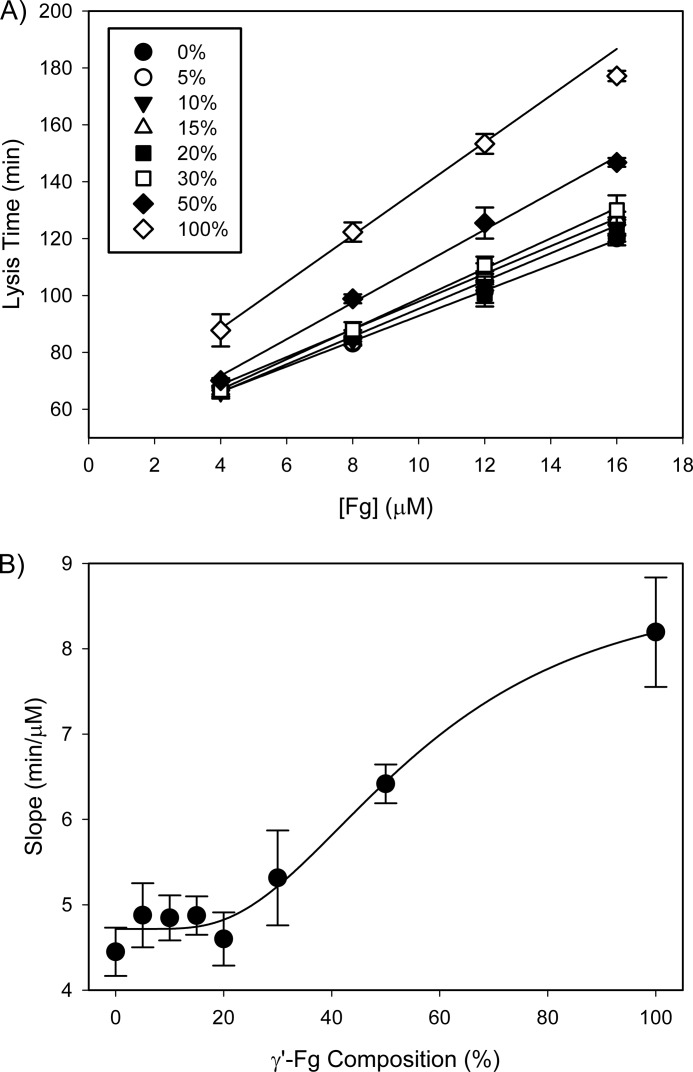
FIGURE 8.
Influence of the extent of γ′-Fg composition on clot lysis times. A, samples containing total Fg concentrations ranging from 4 to 16 μm were prepared with varying amounts of γ′-Fg relative to γA-Fg. Clots were formed, and lysis was monitored as described in the legend for Fig. 2. Lysis times are plotted versus initial Fg concentration, and data were analyzed by linear regression. B, slopes from A are plotted versus the percentage of γ′-Fg composition. Symbols represent the means of at least three experiments, while the bars reflect S.D.

