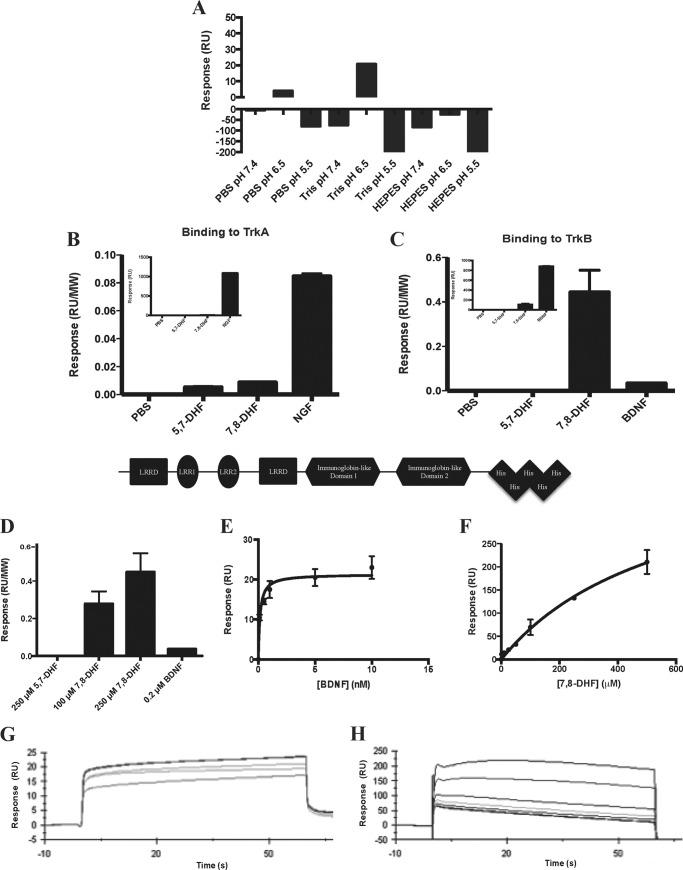
FIGURE 1.
7,8-DHF binds specifically to the extracellular domain of the TrkB receptor. A, optimization of buffer conditions for the SPR binding assay. SPR was used to measure the binding of 7,8-DHF to human His-TrkB-ECD, which was immobilized to an NTA-coated sensor chip. Various buffers with different pH values were tested to determine the optimal buffer for the analyte. Tris buffer (pH 6.5) was found to have the most optimal binding signal. B, the selectivity of 7,8-DHF binding was determined by measuring the binding between PBS, 250 μm 5,7-DHF, 250 μm 7,8-DHF, or 0.2 μm NGF to His-TrkA-ECD. The response (RU) was normalized by molecular weight (MW) to account for the difference in molecular weight between the small molecule and protein analytes (molecular mass of 5,7-DHF and 7,8-DHF, 254 Da; molecular mass of the NGF homodimer, 26,000 Da). The inset displays the absolute binding signal observed for each analyte. Error bars represent mean ± S.D. of two independent experiments. C, the binding of PBS, 250 μm 5,7-DHF, 250 μm 7,8-DHF, or 0.2 μm BDNF was measured for His-TrkB-ECD. The response (RU) was normalized by molecular weight to account for the difference in molecular weight between the small molecule and protein analytes (molecular mass of BDNF, 28,000 Da). The inset displays the absolute binding signal observed for each analyte. Error bars represent mean ± S.D. of two independent experiments. B and C, bottom panel, schematic of the human TrkB-ECD with a C-terminal His6 tag. LRRD, leucine-rich repeat domain. D, the specific binding of 7,8-DHF to TrkB is concentration-dependent as the signal for 100 and 250 μm 7,8-DHF increases, whereas no signal is observed for 5,7-DHF binding. E, binding curve for BDNF binding to TrkB showing the RUs obtained when 0, 0.1, 0.5, 1, 5, or 10 nm BDNF was injected over TrkB. Error bars represent mean ± S.D. of two independent experiments. F, binding curve for 7,8-DHF binding to TrkB showing the RUs obtained when 0, 1, 5, 10, 25, 50, 100, 250, or 500 μm 7,8-DHF was injected over TrkB. Error bars represent mean ± S.D. of two independent experiments. G, sensorgrams obtained from the SPR analysis of the binding affinity of BDNF, which was injected over the TrkB receptor-bound chip surface. The KD was 1.7 nm and was obtained by fitting the data in the BIAevaluation kinetic analysis software. H, sensorgrams obtained from the SPR analysis of the binding affinity of 7,8-DHF, which was injected over the TrkB receptor-bound chip surface. The KD was 15.4 nm and was obtained by fitting the data in the BIAevaluation kinetic analysis software.

