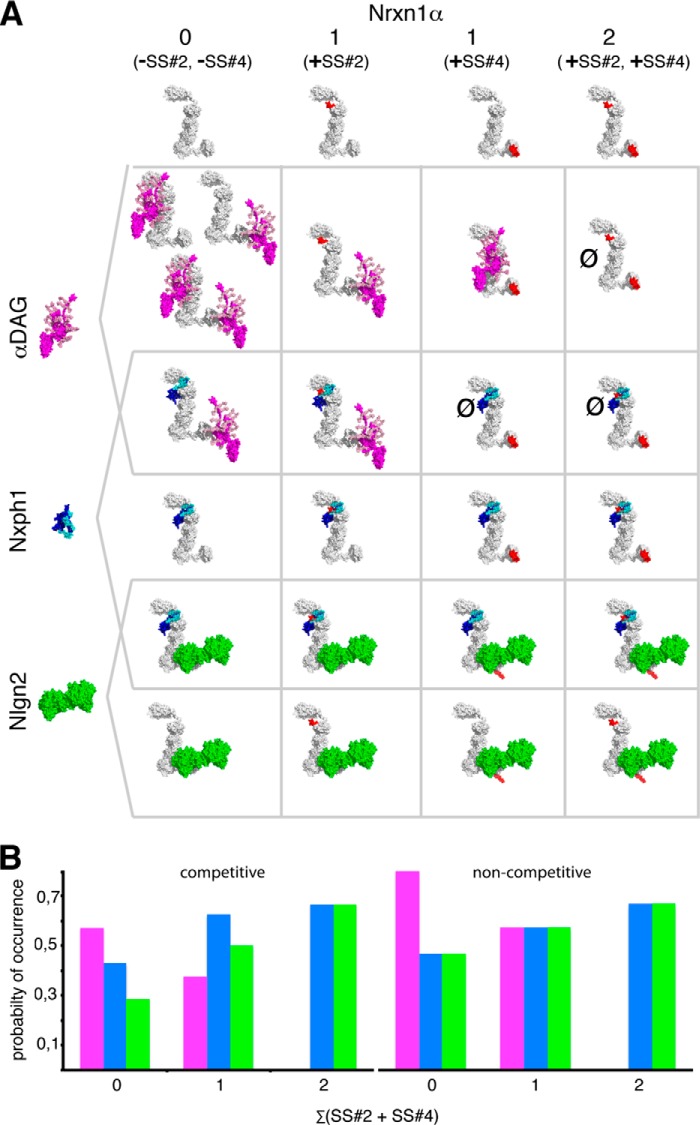
FIGURE 8.
Schematic summary of α-Nrxn-based multiplexes at a virtual inhibitory synapse. A, binding matrix of αDAG (magenta), Nxph1 (blue), and Nlgn2 (green) forming binary and triple complexes with Nrxn1α (white) as determined experimentally in this study. All of these molecules are present or even enriched at inhibitory terminals (Refs. 10, 36, 45 and47 and Fig. 1). We used available crystal structures of Nrxn1α (PDB codes 3POY and 3R05) and Nlgn2 (PDB code 3BL8) and generated model structures of αDAG without the N-terminal domain (97) and of Nxph1 to create complexes. The Nlgn dimer and αDAG are of comparable size (radius of gyration (Rg) of 40 and 35 Å, respectively), and both are as long as the rigid core unit LNS2-to-LNS5 of α-Nrxn (Rg = 37 Å). Both αDAG and Nlgn2 cover the LNS5 that may cause steric hindrance and explain the mutually exclusive binding of αDAG and Nlgn2 to Nrxn1α. B, probability of Nrxn1α in complex with αDAG (magenta), Nxph1 (blue), and/or Nlgn2 (green), calculated from the total number of possible complexes that are limited by competitive binding (left panel). αDAG complexes appear with higher probability when Nrxn1α is splice insert-free, whereas Nlgn2 complexes increase with inclusion of inserts at SS#2 and/or SS#4. If non-competitive binding was assumed, the splice-insert dependence of Nlgn2 and the advantage of αDAG over Nlgn2 complexes would be diminished (no competition, right panel). The size of molecules in A are to scale, and the modeled complexes were generated using two criteria, (i) coverage of hot spots and (ii) maximal surface area buried (see “Experimental Procedures”). Note that in addition to the complexes shown, other conformations are not excluded. The model of Nlgn·Nrxn1α modified from Refs. 33 and 66.

