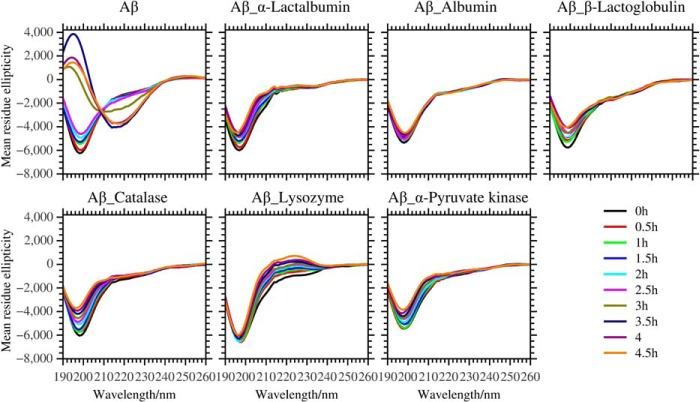
FIGURE 3.
The secondary structure transition of 10 μm Aβ in the absence and presence of the test proteins: 0. 5 μm α-lactalbumin, 1.25 μm albumin, 1 μm β-lactoglobulin, 0.25 μm catalase, 1 μm lysozyme, and 0.05 μm pyruvate kinase by CD spectroscopy. In the assay, we recorded the kinetics of structural transition in the time interval of 0.5 h, black (0 h), red (0.5 h), green (1 h), blue (1.5 h), cyan (2 h), magenta (2.5 h), dark yellow (3 h), navy (3.5 h), purple (4 h), and orange (4.5 h).

