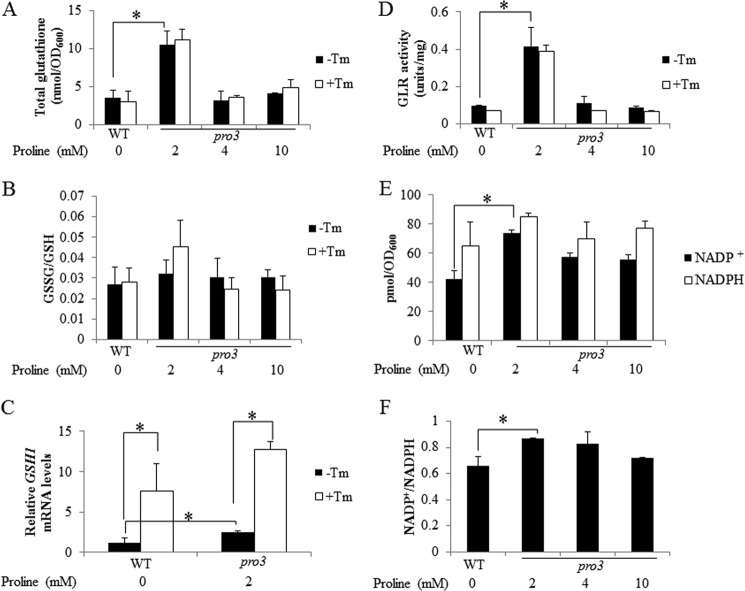
FIGURE 4.
Proline limitation results in redox imbalance in pro3. WT cells and pro3 cells were grown to log phase in SD medium with varying concentrations of proline (0–10 mm) as indicated and treated with (+Tm, 1 μg/ml) or without Tm (−Tm) for 2 h. The following parameters were then determined. A, total intracellular glutathione. B, ratio of oxidized (GSSG) to reduced glutathione (GSH). C, relative GSH1 mRNA levels (4 h of Tm treatment) determined by real-time PCR with mRNA levels normalized to the internal control ACT1 and the lowest expression set at 1. D, GLR activity. The concentrations of NADP+ and NADPH (E) and the corresponding ratio of NADP+/NADPH (F) were determined in WT and pro3 cells grown in SD medium as above but without Tm treatment. Data are the mean ± S.D. from three independent experiments (*, p < 0.05).

