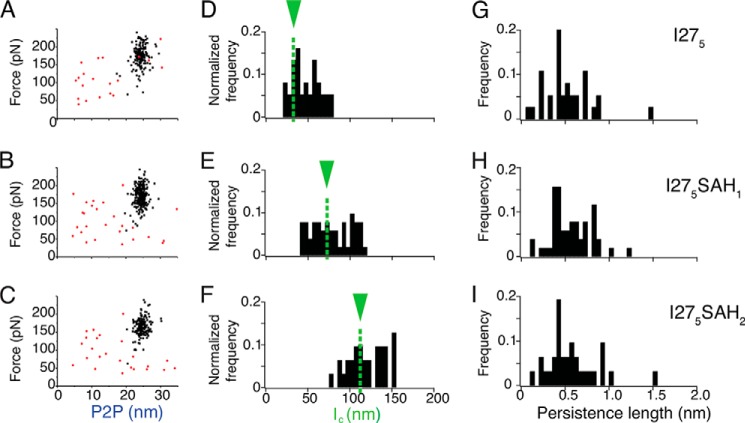
FIGURE 4.
Analysis of single molecule force spectroscopy results for I275, I275SAH1, and I275SAH2. A–C, scatter plots of unfolding forces versus P2P distances for I275 (A), I275SAH1 (B), and I275SAH2 (C). The black squares show the unfolding forces for the I27 domains, and red circles represent any peaks preceding the first I27 unfolding event. The P2P calculated for each construct is shown in Table 1. D–F, histograms of lc calculated from the WLC fit to the first I27 unfolding event for each of the three constructs. Altering the bin size to 2 or 20 nm yielded similar distributions. The green arrow and green dashed lines in D–F, show the expected contour length values (Table 1), including the number of residues in the SAH domain. G–I, associated persistence length histograms describing the wormlike chain fit to the first I27 unfolding event for each construct. The three constructs give very similar distributions for persistence length. Altering the bin size to 0.02 or 0.2 nm gave similar distributions.

