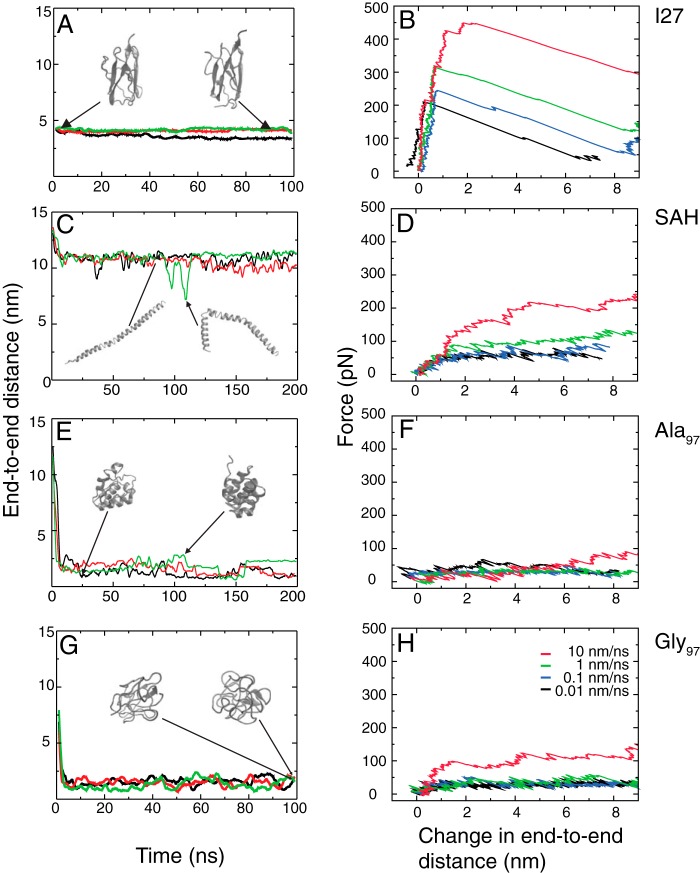
FIGURE 5.
Simulations of I27, SAH, Ala97, and Gly97 peptides. A, C, E, and G show the variation in rNC as a function of time at zero force. The total length of simulation was 200 ns for the SAH domain and Ala97 and 100 ns for Gly97 and I27. The data are presented as running averages over 2-ns intervals. Three separate simulations are shown (red, green, and black lines). Insets show snapshots of structures from one of the three simulations. The second snapshot in C has the lowest rNC from all SAH simulations and represents a rarely occurring and transient bent structure. The initial small drop in rNC observed for the SAH domain occurs as the peptide initially relaxes from its starting perfect α-helical structure. Example simulations for I27, the SAH domain, Ala97, and Gly97 are shown as supplemental Movies 1–4, respectively. B, D, F, and H show example force-extension traces from MD simulations. Pulling speeds were 10 (red), 1 (green), 0.1 (blue), and 0.01 nm/ns (black) and are presented as running averages over 0.01-, 0.1-, 1-, and 10-ns intervals, respectively. The cantilever spring constant (kc) is 30 pN/nm in each case. Example simulations are shown in supplemental Movies 5–8. The starting structure for I27 is its native structure, and the direction of pull is determined by the vector between the N and C termini. The starting structure for the SAH domain and Ala97 is a straight helix, whereas that for Gly97 is a compact random coil. As the proteins have different initial lengths and in particular the helices are longer than the folded I27 and collapsed Gly97 structures, the data are presented as the change in the end-to-end distance (rNC) from the initial protein conformer.

