
FIGURE 6.
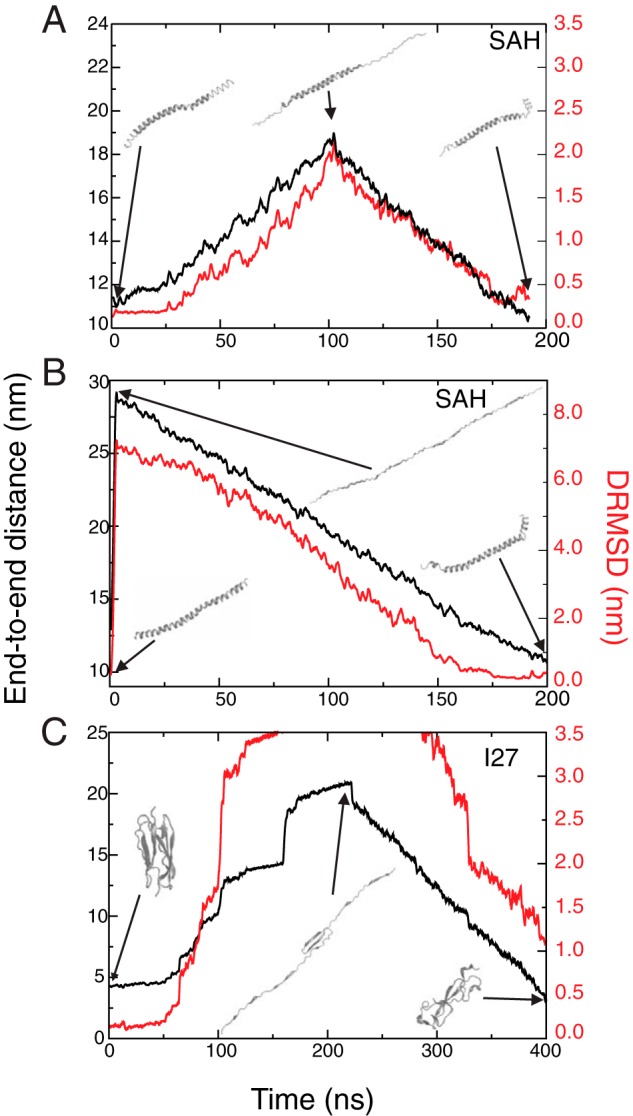
Simulations that investigate the refolding of the SAH domain (A and B) and I27 (C). A force was applied to the ends of the peptides by adding springs to the N and C termini and moving them apart at 0.1 nm/ns (except in B where it was 10 nm/ns), and this procedure was then reversed so that the N and C termini approach one another at a velocity of 0.1 nm/ns to determine whether the peptides could refold. The force constant for the springs was 30 pN/nm. Plotted on each graph are the end-to-end distances (black; left axis), which show how the distance between the termini of all molecules first increases during pulling and then decreases on pulling reversal. The DRMSD values, which provide a measure of the similarity of the structure during the simulation to the initial structure, are shown in red (right axis). DRMSD is the root mean square deviation of the internal distances matrix involving the peptide backbone atoms from that computed for the initial structure. Snapshot images of the peptide structures during the simulation (positions indicated by the arrows) are shown.