FIGURE 3.
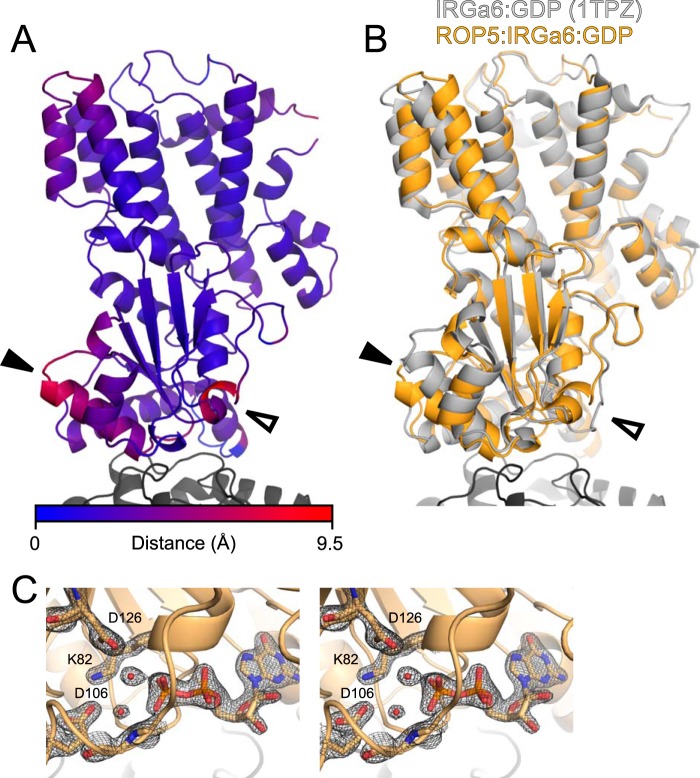
ROP5 binding induces conformational changes throughout the IRGa6 structure. A, the ROP5-bound structure of IRG is shown colored according to Cα displacement compared with the published ROP5-unbound IRGa6-GDP structure (Protein Data Bank code 1TPZ). B, the ROP5-bound structure of IRGa6 (orange) is overlaid on the published IRGa6-GDP structure (Protein Data Bank code 1TPZ). In both panels, helix 3 is indicated with a closed arrowhead, and switch loop I is indicated with an open arrowhead. Cα RMSD of IRGa6 between the two structures is 2.1 Å over 399 atom pairs (2.6 Å over the G-domain alone; 166 atom pairs). C, stereo image of switch loop I and the bound GDP in the ROP5-IRGa6 structure superposed with the 2Fo − Fc electron density map countered at 2.0σ.

