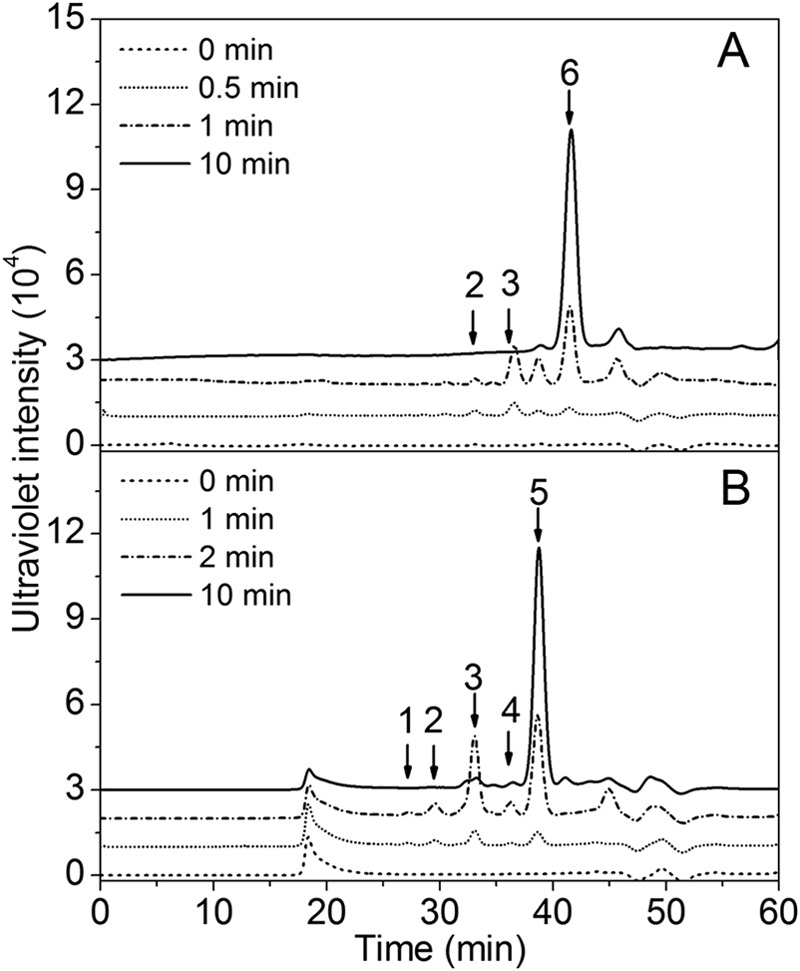
FIGURE 4.

Time course experiments of rHCLase degradation of HA and CS-A. HA (A) or CS-A (B) (1 mg/ml) was treated with rHCLase (1 unit/ml), and a 10-μl aliquot was taken at different time points for gel filtration analysis as described under “Experimental Procedures.” The elution positions of the following standard oligosaccharides are indicated by arrows: 1, CS or HA octasaccharide fraction; 2, CS or HA hexasaccharide fraction; 3, CS or HA tetrasaccharide fraction; 4, disulfated CS disaccharide fraction; 5, monosulfated CS disaccharide fraction; 6, nonsulfated CS or HA disaccharide.
