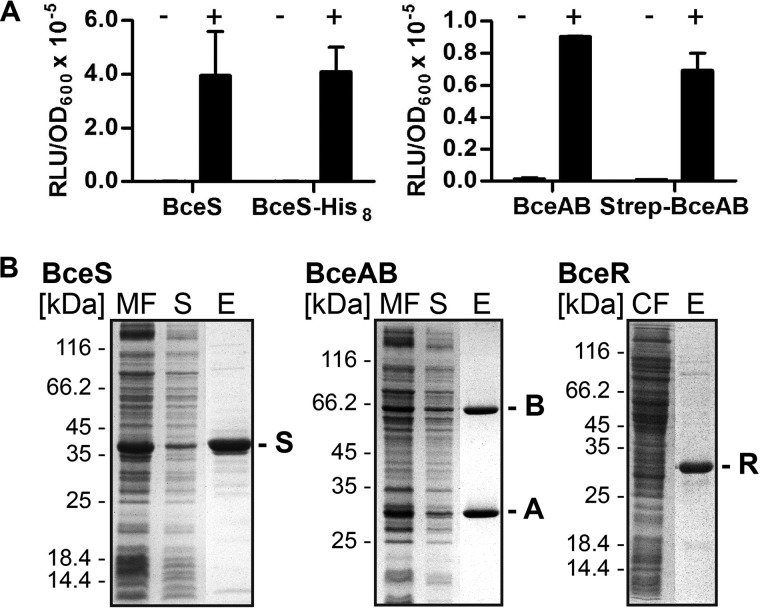
FIGURE 3.
A, signal transduction activities of affinity-tagged BceAB and BceS. Exponentially growing cells of strains carrying the PbceA-luxABCDE reporter were challenged with 30 μg/ml Zn2+-bacitracin (+) or left untreated (−). Luminescence (relative luminescence units, RLU) was measured at 48 min post-induction. Luminescence was normalized to cell density and is expressed as relative luminescence units/A600. The left graph shows complementation of bceS deletion by untagged (left) and His-tagged (right) BceS. The right graph shows complementation of bceAB deletion by untagged (left) and Strep-tagged (right) BceAB. Data are shown as the mean ± S.D. of three to four independently performed experiments. B, affinity purification of BceAB, BceS, and BceR from E. coli C43(DE3) cells. Left panel, BceS with a C-terminal His8 tag was purified with a Ni2+-NTA column. Center panel, BceAB carrying an N-terminal Strep II®-tag on the ATPase domain was purified via a Strep-Tactin® column. Right panel, BceR carrying a C-terminal His10 tag was purified with a Ni2+-NTA column. Proteins were analyzed using SDS-PAGE, and gels were stained with Coomassie Brilliant Blue. Purified proteins are indicated on the right by the last letter of their name. A molecular size marker is indicated on the left in kDa. MF, membrane fraction; S, solubilized fraction; E, elution; CF, cytoplasmic fraction.

