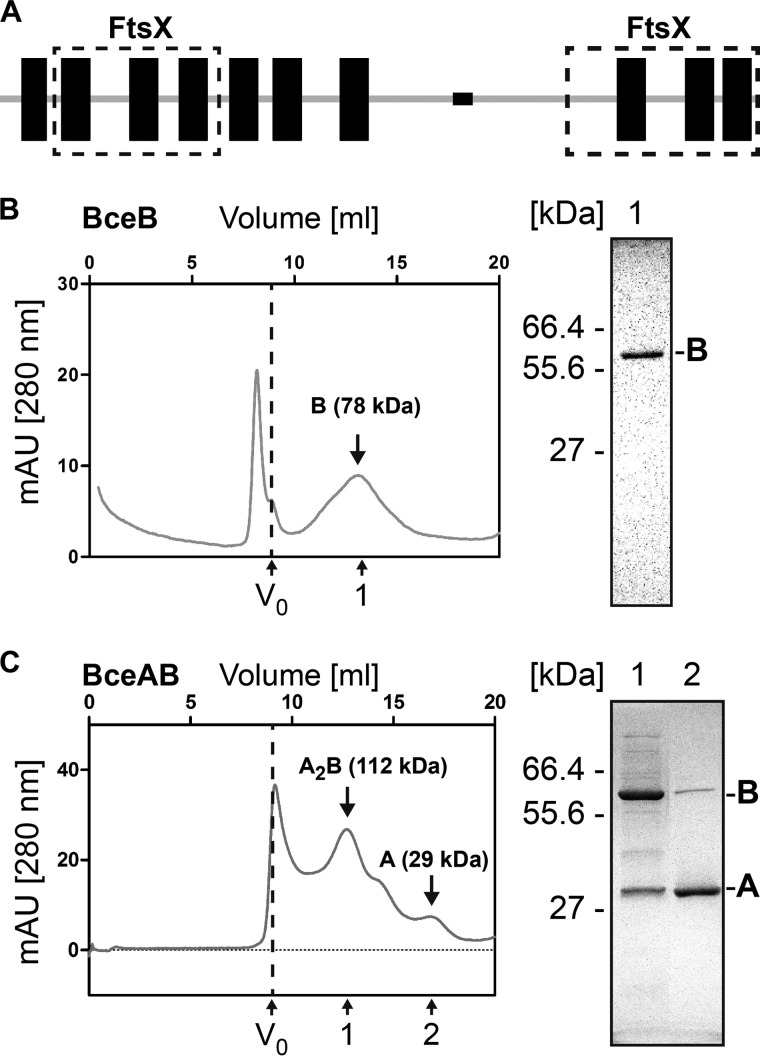
FIGURE 4.
Size exclusion analysis of the BceAB complex. A, conserved domain analysis of BceB. TM helices are shown as black rectangles. FtsX domains are indicated by dashed boxes. Predictions were done using the SMART database (41). B and C, size exclusion analysis of BceB (B) and BceAB (C) on a Superdex 200 10/30 column. Left panels show the chromatograms. The vertical dashed line indicates the void volume (V0) of the column. The calculated molecular mass corresponding to the major eluted peaks is shown in parentheses, and eluted proteins are given by the last letter of their name. The right panels show the corresponding SDS-PAGE analysis of the fractions indicated by numbers below the chromatograms. A molecular size marker is indicated on the left in kDa; proteins are indicated on the right by last letter of their name. mAU, milli absorbance units.

