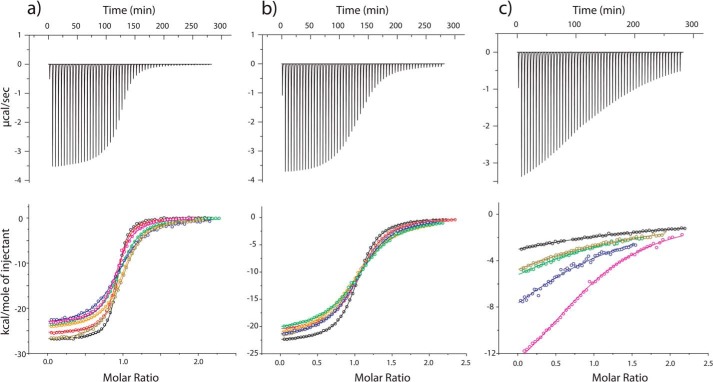
FIGURE 3.
Isothermal titration calorimetry raw thermograms (top) and integrated heats (bottom) for RR (a), SR (b), and SS (c) peptides binding to the Fyn SH3 domain at 40 °C and different ionic strength. Black, 0 mm NaCl added; red, 33 mm; orange, 200 mm; dark yellow, 300 mm; green, 500 mm; blue, 1000 mm; magenta, 2000 mm. Raw thermograms were obtained with 0 m added salt.

