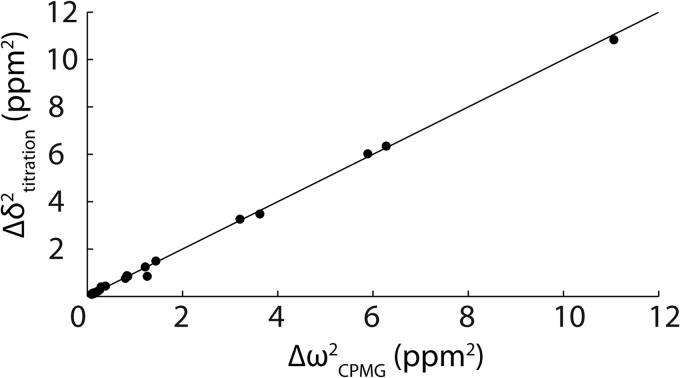
FIGURE 6.
Comparison of Δω215N chemical shift parameters extracted from CPMG relaxation dispersion NMR experiments performed on the Fyn SH3 domain partially saturated with the RR peptide (0 m NaCl) and Δδ2 peak displacements from a comparison of the Fyn SH3 domain spectra free and saturated with the RR peptide (0 m NaCl). The line goes through the origin with a slope of 1.

