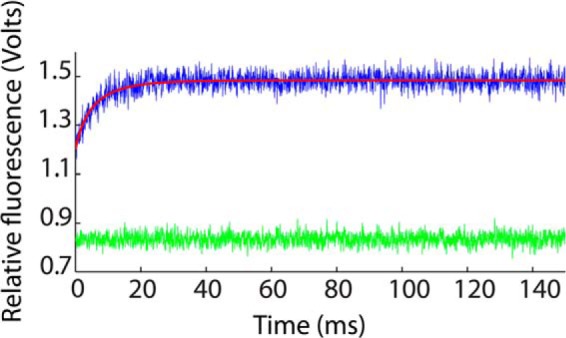
FIGURE 7.

Stopped-flow fluorescence data for the Fyn SH3 domain rapidly mixed with buffer (green) and with a solution of the RR peptide (blue). Data shown are the averages of 100 individual stopped-flow traces. The best fit using Equation 12 is indicated with a red line.
