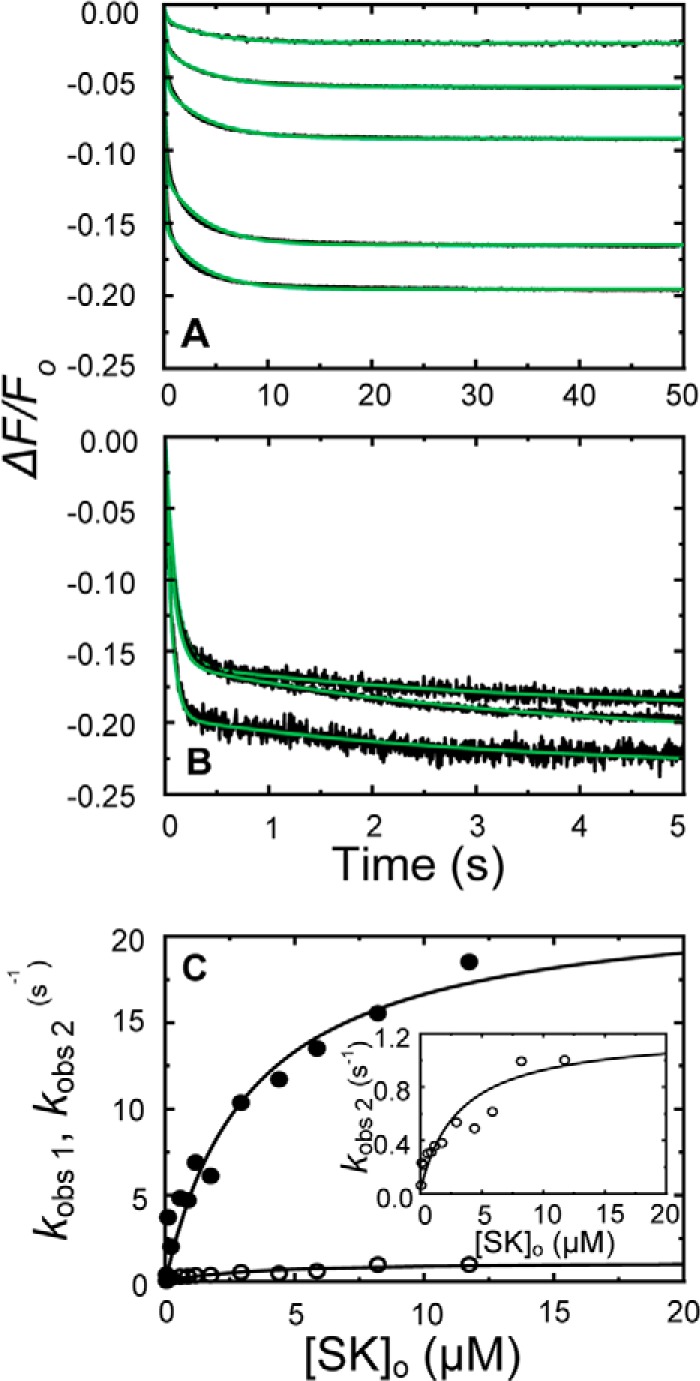
FIGURE 4.

Kinetics of SK binding to [5F]FFR-[Lys]Pg in 50 mm 6-AHA. A and B, the fractional fluorescence intensity changes (ΔF/Fo) following rapid mixing of [5F]FFR-[Lys]Pg and nSK versus time in 50 mm 6-AHA are shown for 20 nm [5F]FFR-[Lys]Pg and 0.10, 0.26, 0.53, 1.53, and 3.06 μm nSK (A) and at 10 nm [5F]FFR-[Lys]Pg and 2.93, 4.40, and 8.21 μm nSK (B). Green solid lines represent the fits from numerical integration as described under “Experimental Procedures.” C, dependences of kobs 1 (●) and kobs 2 (○) on the total nSK concentration ([SK]o) are shown for binding to 10–20 nm [5F]FFR-[Lys]Pg. The inset shows the kobs 2 dependence on an enlarged scale. Solid lines represent the least-squares fits by Equation 2 with the parameters given in Table 1. Experiments were performed and analyzed as described under “Experimental Procedures.”
