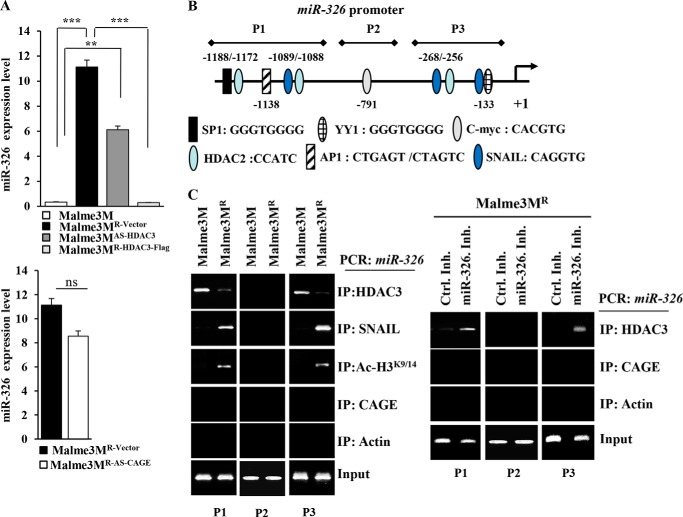
FIGURE 12.
HDAC3 directly regulates the expression of miR-326. A, expression level of miR-326 in each cancer cell line was determined by qRT-PCR analysis. ***, p < 0.0005. ns denotes not significant. B, shows the potential binding sites of various transcriptional factors in miR-326 promoter sequences. C, cell lysates from the indicated cancer cell lines were immunoprecipitated (IP) with the indicated antibody (2 μg/ml), followed by ChIP assays (left panel). Malme3MR cells were transfected with control inhibitor (50 nm) or miR-326 inhibitor (50 nm). 48 h after transfection, cell lysates were isolated and subjected to ChIP assays (right panel).

