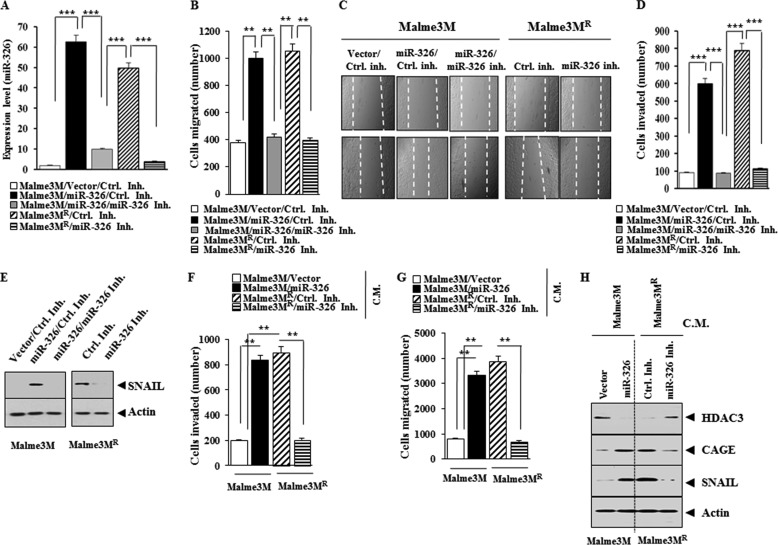
FIGURE 14.
miR-326 regulates the migration and invasion potential of cancer cells. A, indicated cancer cells were transfected with the indicated construct (1 μg) or inhibitor (50 nm). 48 h after transfection, qRT-PCR analysis was performed. B, same as A except that wound migration assay was performed. C, movement of cells into wound was shown for the indicated cancer cell lines at 0 and 48 h post-scratch (×40). Data were the means of three independent experiments, and the bars represent mean ± S.D. The broken lines indicate the boundary lines of scratch. D, same as B except that invasion assay was performed. ***, p < 0.0005. E, same as A except that Western blot analysis was performed. F, Malme3M or Malme3MR cells were transfected with the indicated construct (each at 1 μg) or inhibitor (50 nm each). 48 h after transfection, the conditioned medium was added to Malme3M or Malme3MR cells. The invasion potential of Malme3M or Malme3MR cells was determined by transwell assays. **, p < 0.005. C.M. denotes conditioned medium. G, same as F except that wound migration assays were performed. **, p < 0.005. H, conditioned medium obtained as in G was added to the Malme3M or Malme3MR cells. One hour after addition of the conditioned medium, Western blot analysis was performed. Ctrl. Inh., control inhibitor.

