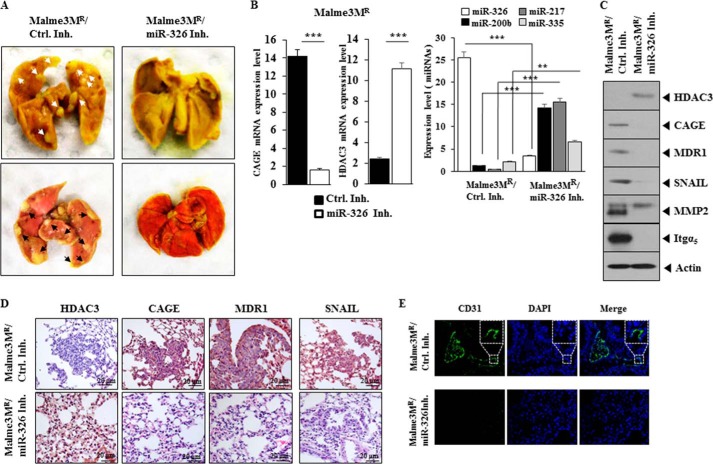
FIGURE 15.
miR-326 regulates the metastatic potential of cancer cells. A, each experimental group consists of five athymic nude mice. Each figure shows a representative image of the mice in each experimental group. Control inhibitor (50 μm/kg) or miR-326 inhibitor (50 μm/kg) was intravenously injected five times over a total of 4 weeks. Arrows show the metastatic foci. The extent of lung metastases was quantified by staining with Bouin's solution. B, mRNAs isolated from lung tumor tissues were subjected to RT-PCR analysis (left panel). ***, p < 0.0005. miRNAs isolated from lung tumor tissues were subjected to qRT-PCR (right panel). **, p < 0.005; ***, p < 0.005. C, lung tumor tissue lysates isolated from mouse of each experimental group were subjected to Western blot analysis. D, immunohistochemistry staining of lung tumor tissue derived from Malme3MR cells treated with the indicated inhibitor was performed. Representative images from five animals from each experimental group are shown (magnification, ×400; Olympus). H&E staining was performed to check structural integrity. E, immunohistochemistry staining employing anti-CD31 was employed to determine the effect of miR-326 inhibitor on the angiogenic potential of Malme3MR cells. Representative images from five animals from each experimental group are shown (magnification, ×100; Olympus). DAPI staining was performed to stain nuclei. Ctrl. Inh., control inhibitor.

