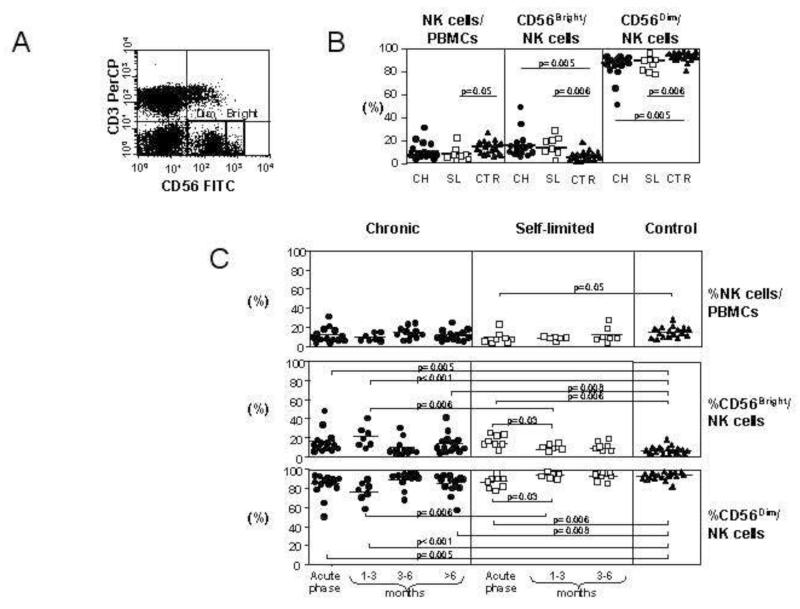
Figure 1. Changes in NK cell subsets during acute HCV infection.
Panel A: representative flow cytometry dot plot of the CD56bright CD3− and CD56dim CD3− populations in acute HCV infection. Panel B: frequency of NK cells as a percentage of the lymphocyte population and the frequencies of CD56bright and CD56dim NK cells as a percentage of the total NK population in 14 chronically evolving patients (CH, circles), 8 self-limited patients (SL, squares) and 17 healthy controls (CTR, triangles). Panel C: changes in NK cells in the follow-up phase of infection. The upper panel shows NK cells as a percentage of the live lymphocyte gate, and the middle and lower panels show the relative proportions of CD56bright (middle) and CD56dim (lower) NK cells.

