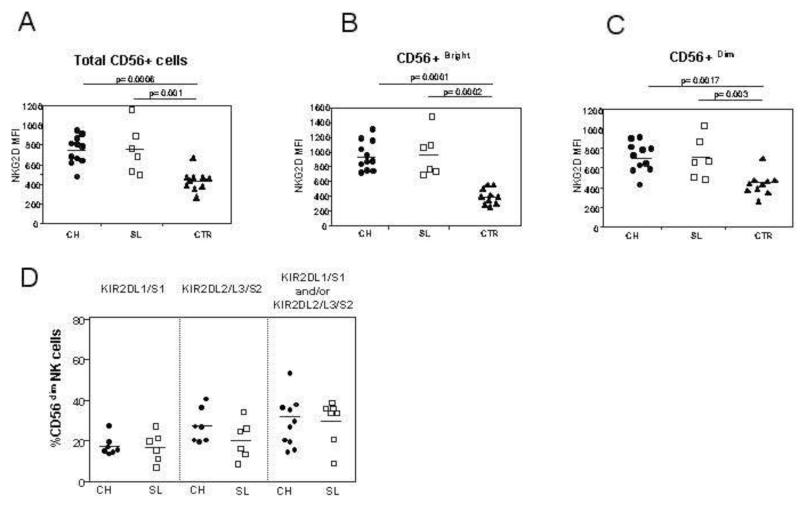
Figure 2. NK cell receptor expression in the three patient populations.
Panels A-C: NKG2D expression on total NK cells (A), on CD56bright NK cells (B) and on CD56dim NK cells (C). The expression of these receptors in the acute phase are compared between 11 patients with acute HCV infection and chronic evolution (CH, circles), 6 with self-limited infection (SL, squares) and 10 healthy controls (CTR, triangles). Panel D: percentage of NK cells expressing specific KIR molecules in the acute phase of infection, as determined by GL183 (anti-KIR2DL2/3/S2) and EB6 (anti-KIR2DL1/S1) in individuals with acute HCV infection. The left panel shows the frequency of KIR2DL1/S1 NK cells in individuals with group 2 HLA-C allotypes; the middle panel shows the frequency of KIR2DL2/3/S2 in individuals with group 1 HLA-C alleles and the right panel shows the total number of NK cells expressing a KIR cognate for the HLA-C alleles of the individual (either group1 HLA-C, group 2 HLA-C or both group 1 and group 2 HLA-C).

