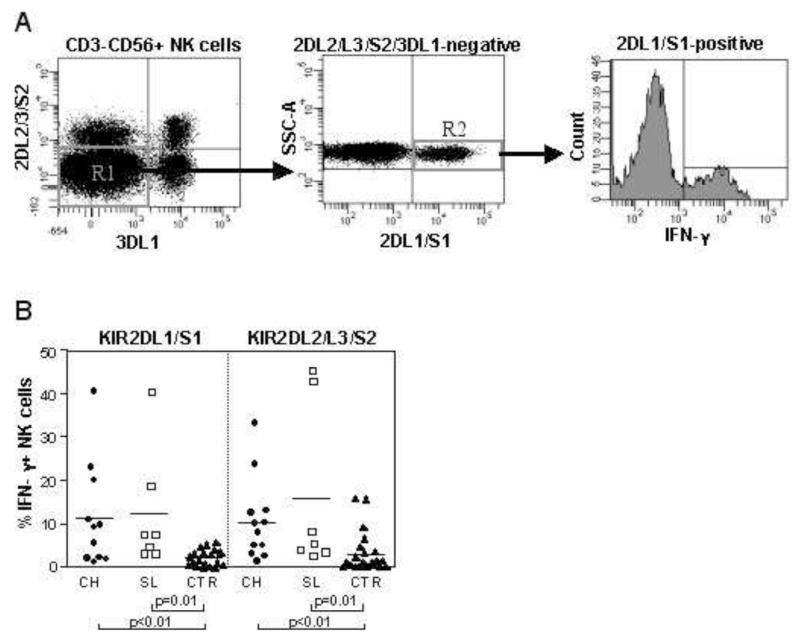
Figure 4. Activation of KIR+ NK cells during acute HCV infection.
Panel A: representative flow cytometry dot plot to illustrate the gating strategy used to obtain NK cells single positive (SP) for one specific KIR group, in this case KIR2DL1/S1. In this plot CD3− CD56dim NK cells were gated and NK cells negative for both KIR2DL2/L3/S2 and KIR3DL1 were analysed for expression of KIR2DL1/S1. The histogram shows IFN-γ production by these KIR2DL1/S1 positive NK cells. Panel B: percentage of IFN-γ producing NK cells single positive for KIR2DL1/S1 or KIR2DL2/3/S2 in the acute phase of infection in patients with acute hepatitis and healthy controls. Circles depict patients with chronically evolving infection (n=12), squares individuals with self-limited infection (n=7) and triangles represent the controls (n=17).

