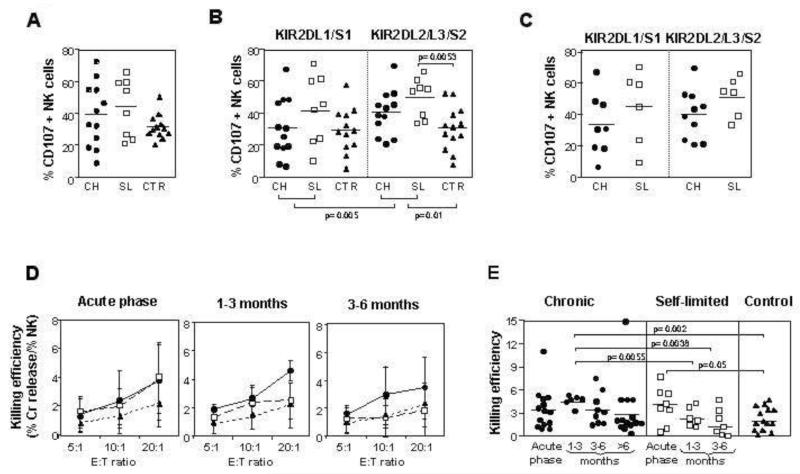
Figure 5. Up-regulation of NK cell degranulation and cytotoxicity during acute HCV infection.
Degranulation, assessed by surface expression of CD107a, was measured in IL-15 stimulated NK cells following co-culture with K562 target cells. Panel A: the percentage of degranulating CD56dim NK cells, analyzed in the acute phase, is compared between 12 patients with acute HCV infection and chronic evolution, 8 patients with self-limited infection and 11 healthy controls. No statistically significant differences were found between the groups. Panel B: percentage of NK cells single positive for KIR2DL1/S1 or KIR2DL2/3/S2 that express CD107a in the acute phase in individuals with acute hepatitis and in the healthy controls. Circles depict individuals with chronic infection, squares those with self-limited infection and triangles represent the controls. Comparisons by Mann-Whitney U test revealed significant differences in CD107 upregulation between NK cells single positive for KIR2DL2/L3/S2 in the total patient population, as well as in the self-limited group compared with healthy controls. A statistical difference was also detected between NK cells single positive for KIR2DL1/S1 and those single positive for KIR2DL2/L3/S2 in the whole patient population. Panel C: comparison of CD107a expression on KIR2DL1/S1 or KIR2DL2/3/S2 NK cells in the acute phase in HCV infected individuals who have the cognate HLA-C ligand (group 2 and group 1 respectively). Individuals with chronic evolution are depicted with closed circles and those with self-limited hepatitis with open squares. No statistically significant differences were found between the different types of infection. Panel D: cytotoxic activity in the acute and follow-up phases of infection normalised for NK cell number, as tested by 51Cr-release assay against K562 cells. Results are shown for individuals with chronic evolution of acute infection (circles and full line), self-limited infection (squares and dashed line) and 14 healthy controls (triangles and dotted line) at varying effector to target (E:T) ratios. Fourteen individuals with chronic evolution and 8 with self-limited infection were evaluated in the acute phase; 6 in each group at one to three months, and 9 with chronic evolution and 7 with self-limited at three to six months. The mean and standard deviations are shown. Panel E: cytotoxicity against K562 targets normalized for NK cell number in the acute phase and early follow-up phase of infection at the E:T ratio of 20:1. The numbers of patients and controls are the same as those illustrated in panel D, with 14 additional chronic patients analyzed at later follow-up time points.

