Figure 3.
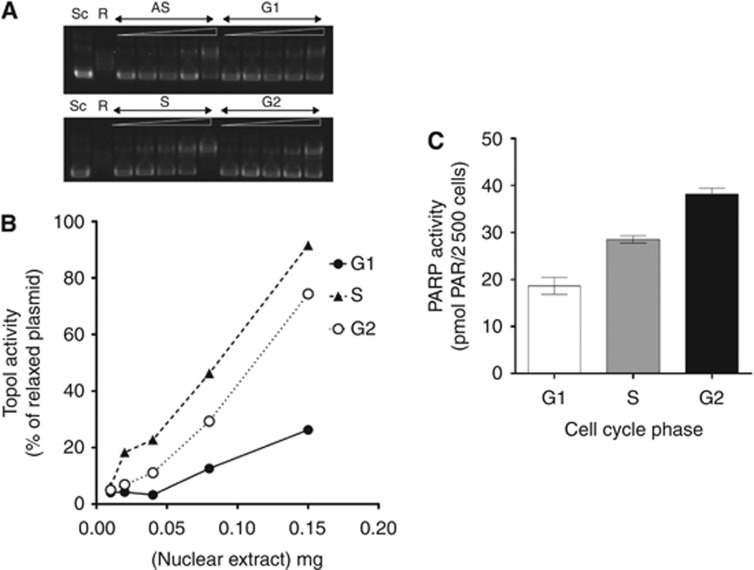
Topo I and PARP activity in G1, S and G2 elutriated K562 cells. (A) Nuclear extracts were prepared from asynchronous or elutriated cells. Approximately, 1 μl of the extracts (containing from 0.01 to 0.15 μg protein) was incubated with 1 μg of supercoiled plasmid and reaction products were separated on agarose gel. ‘Sc' refers to a negative control supercoiled plasmid, and ‘R' is a positive control of fully relaxed plasmid. Samples from asynchronous (AS), and G1, S and G2 are shown with increasing amount of protein extract, going from left to right. (B) the bands from A were quantified using ImageJ gel analysis, and Topo I activity is shown as the amount of relaxed DNA as a percentage of total DNA. (C) Exponentially growing K562 cells were elutriated and fractions containing >90% cells in G1, S and G2 cell cycle phases were used to measure PARP-1 activity (data are mean±s.e.m. of three independent experiments).

