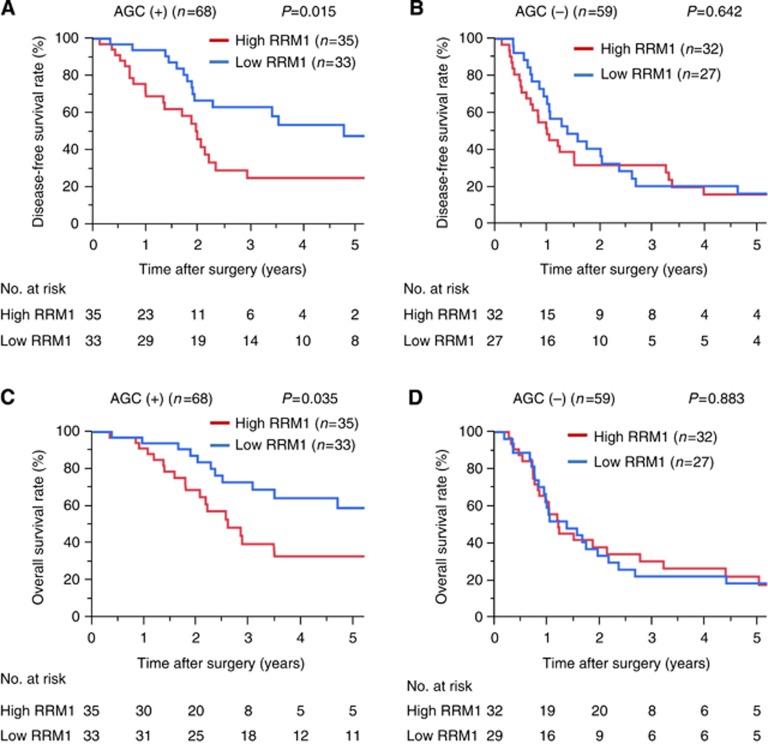
Figure 3.
DFS and OS curves stratified by intratumoural RRM1 expression. AGC (+) indicates subgroups of patients who received adjuvant gemcitabine-based chemotherapy; AGC (−) indicates subgroups of patients who did not receive adjuvant gemcitabine-based chemotherapy. (A) DFS curves in AGC (+) patients (P=0.015). (B) DFS curves in AGC (−) patients (P=0.642). (C) OS curves in AGC (+) patients (P=0.035). (D) OS curves in AGC (−) patients (P=0.883).

