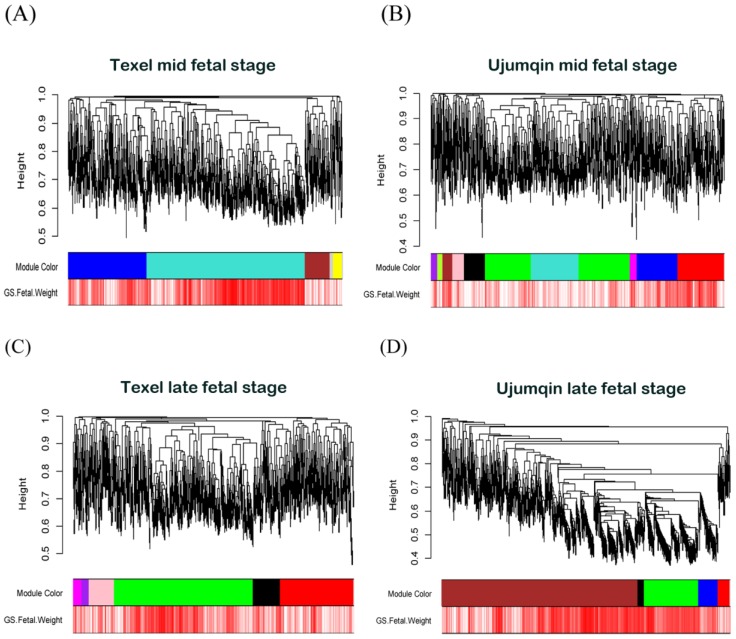
Figure 2.
Visual representations of the four gene co-expression networks and corresponding gene significant. The Network A was served as reference Network, module colors of other networks were redefined using matchLabels function in WGCNA R package to match the corresponding module in network A. (A) Hierarchical clustering of 1472 genes in network A constructed from mid-stage fetal skeletal muscles of Texel sheep. The colored bars (below) directly correspond to the module (color) designation for the gene clusters. Five distinct gene modules or groups of genes with high topological overlap were identified in network A. To distinguish between modules, we designated each module with an arbitrary color; grey modules represented poorly connected genes. (B) Hierarchical clustering of 1472 genes in network B constructed from mid-stage fetal skeletal muscles of Ujumqin sheep. (C) Hierarchical clustering of 1472 genes in network C constructed from late-stage fetal skeletal muscles of Texel sheep. (D) Hierarchical clustering of 1472 genes in network D constructed from late-stage fetal skeletal muscles of Ujumqin sheep.

