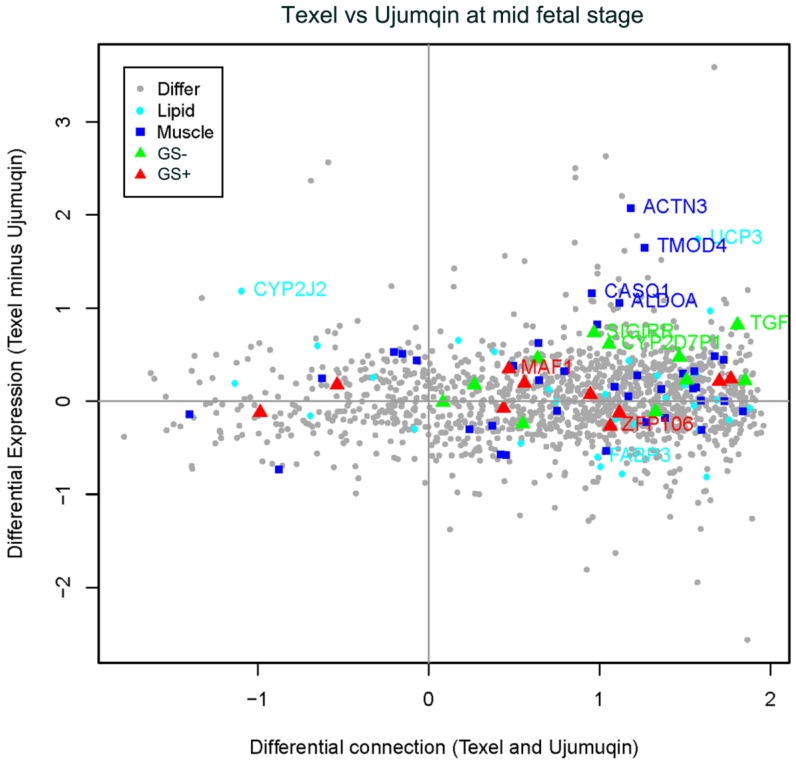
Figure 4.
Plot for the differentially expressed and differentially connected genes in the mid fetal stage. Highly expressed genes in Texel sheep are distributed at the top, and highly expressed genes in Ujumqin sheep are distributed at the bottom. Highly connected genes in Texel sheep are on the right, and highly connected genes in Ujumqin sheep are on the left. Genes with GS values >0.8 were labeled as red triangles (GS+), whereas those with GS values <-0.8 were labeled as green triangles (GS-). Blue rectangles indicate genes related to muscle development while cyan dots indicate genes related to lipid metabolism. Gray dots represent all other genes. The vertical coordinate is denoted by e1-e2, where e1 was average expression value in Texel sheep, e2 was average expression value in Ujumqin sheep and expression value was estimated by Log2 Norm Signals of each probe. On the other hand, the horizontal coordinate is denoted by (t1-u1)/ (t1+u1), where t1 and u1 are gene connection values in Texel and Ujumqin sheep, respectively.

