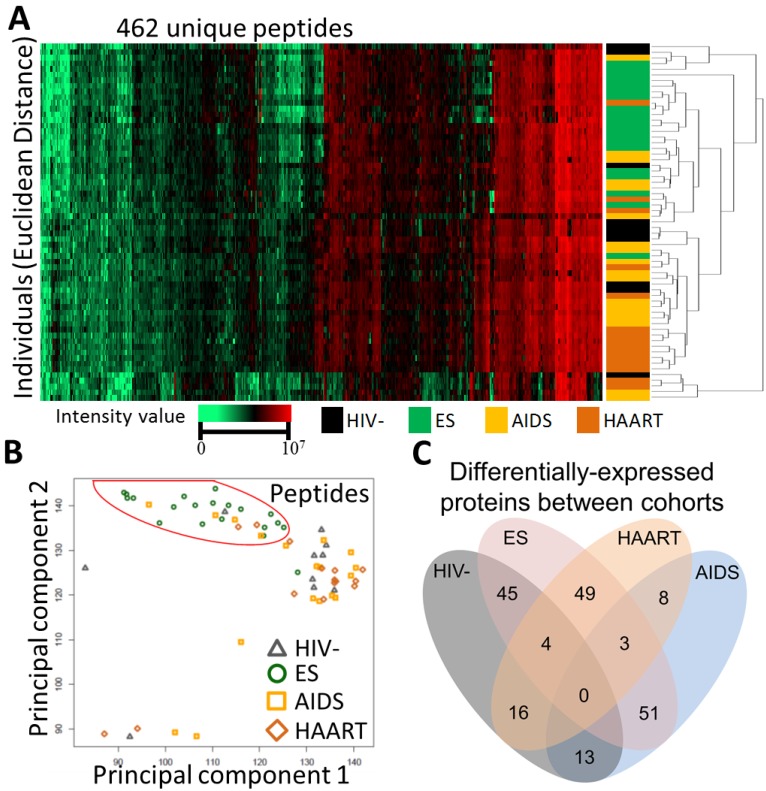
Figure 1.
Separation of ES from other cohorts. (A) Unsupervised hierarchical clustering using relative intensity of peptides for individuals. Euclidean Distance and Spearman Rand were used for individuals and peptides respectively. (B) Principal component analysis using relative intensity of peptides from individuals. Red circle highlighted ES in segregation from other groups. (C) Venn diagram showing the number of significantly changed proteins with a cut off ratio of 1.5-fold and p-value ≤ 0.05 among cohorts.

