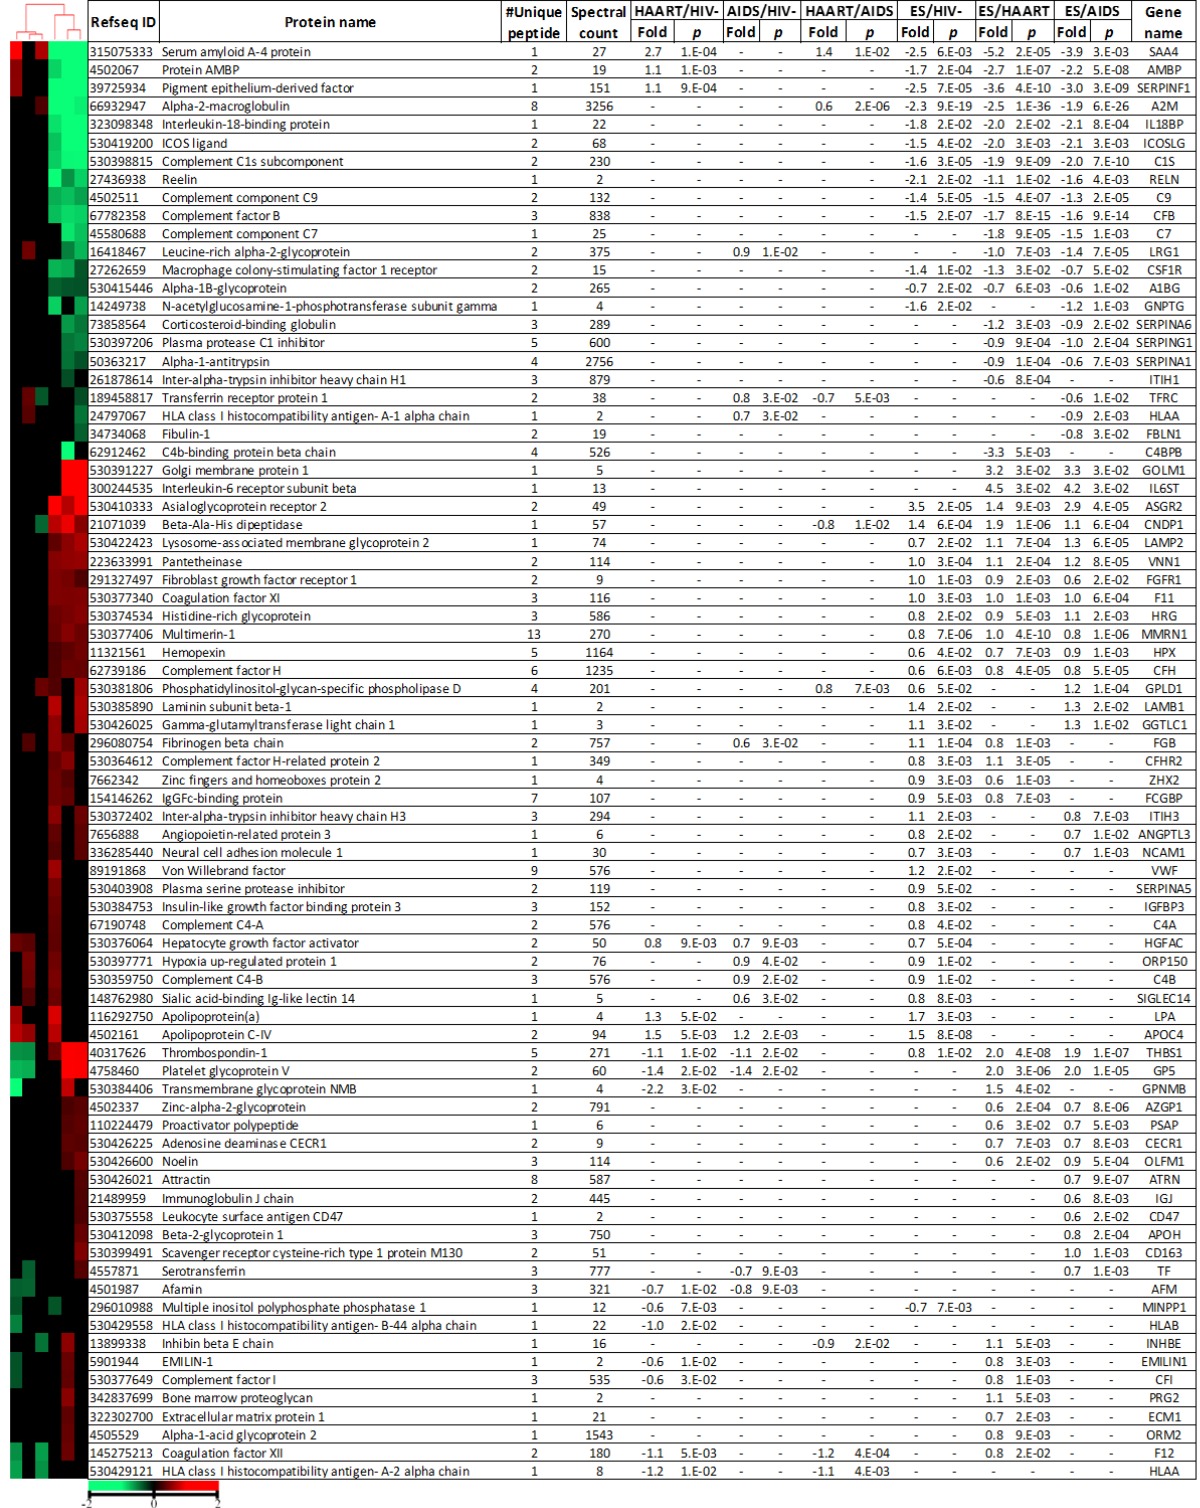
Table 2.
Heat map and differentially expressed glycoproteins among cohorts.

Log2 fold change and p-value were calculated using relative intensity of peptides described in Materials and Methods. Proteins with p-value ≤ 0.05, at least 1.5-fold change and two spectral counts were shown. Euclidian distance and city-block distance were used to cluster cohorts and proteins respectively. Minus (-) indicated not significant.
