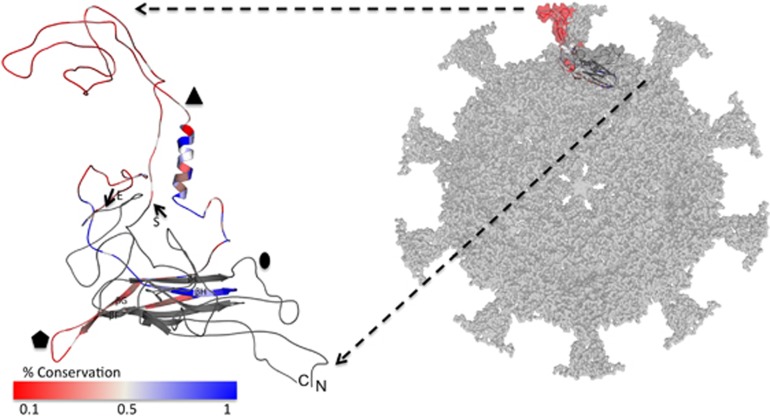
Figure 1.
Surface representation of a Chlamydiaphage-1 (ChP1) capsid homology model is shown in gray looking down the fivefold axis of symmetry of an icosahedron (right). The inset to the left is a cartoon representation of the predicted ChP1 MCP homology model, in which the amplicon region from this study is highlighted with arrows (S: Start; E: End) and has been colored according to residue conservation of the full aligned data set from blue (most conserved; 1) to red (least conserved; 0.1). The N-terminal (N) and C-terminal (C) end of the MCP have been labeled along with the two, three and fivefold axes of symmetry for an icosahedron shown as an oval, triangle and pentagon, respectively. The β-strands of the eight stranded β-barrel that are contained within the amplicon (βF-H) and referenced in the discussion are also labeled.

