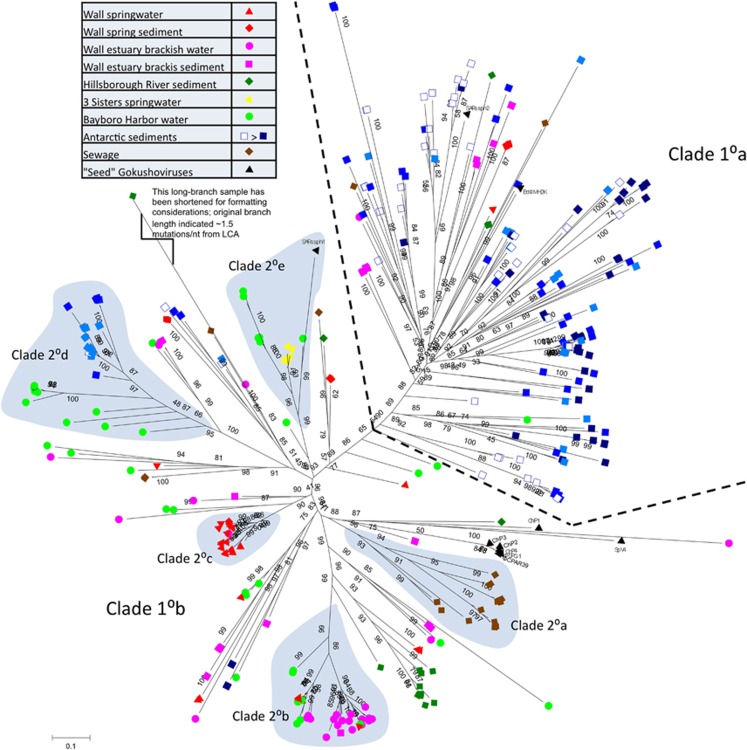
Figure 2.
Unrooted maximum likelihood phylogeny of 316 novel gokushovirus MCP sequences, unique at 97%. Statistical support values are percentages calculated by the aLRT method. Sequences are coded by color (sampling site) and shape (sample type), as shown in the legend. A primary division in the data set is shown with a dashed line and annotation, and small secondary clades of interest are indicated by shading and annotation. The icons are dereplicated, unique sequences, which in one instance represents as many as 19 recovered sequences.

