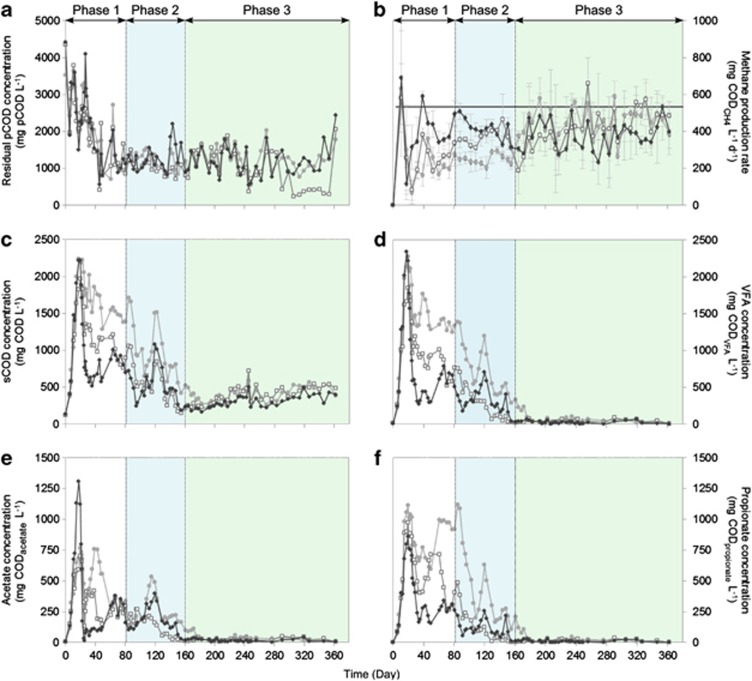
Figure 1.
Reactor performance parameters over time for reactors AD1 (○ grey), AD2 (□ light grey) and AD3 (◊ black). Three distinct phases can be identified (phase 1—start-up, phase 2—stable hydrolysis and phase 3—steady state) showing differences in pCOD concentration (a), methane production rate (b), sCOD concentration (c), total VFA concentration (d), acetate concentration (e) and propionate concentration (f). Methane production was measured daily and average methane production rates were calculated on a weekly basis (error bars represent s.d.).

