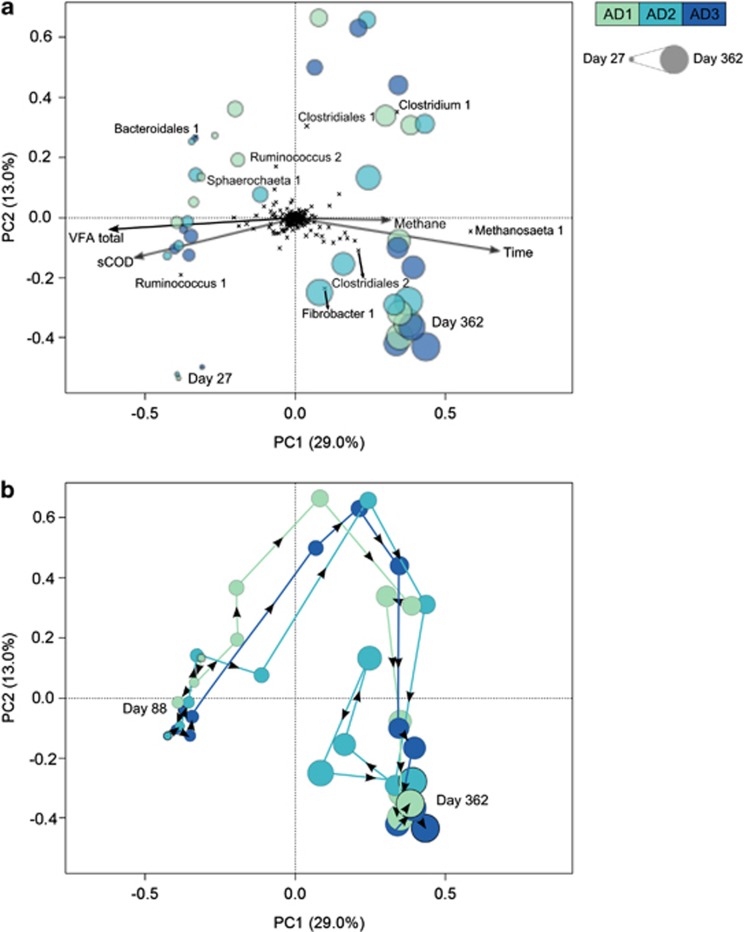
Figure 3.
Microbial community dynamics linked to reactor performance. The PCA shows the microbial community composition at the OTU level (Hellinger transformed) for the three reactors (AD1, AD2 and AD3) at 14 time points. (a) Each sample is symbolised by a single circle coloured by reactor. The size of the circle increases with time. Individual OTUs are represented as black crosses and the taxonomy of those contributing most to the variability between community profiles is provided. Environmental parameter fitting was performed to correlate reactor performance parameters to the community composition and significant correlations are presented by the arrows. (b) Tracking of the microbial community composition in the three reactors over time, starting from day 88. Each line represents the trajectory in the PCA plot (based on community structure) of each reactor over time.

