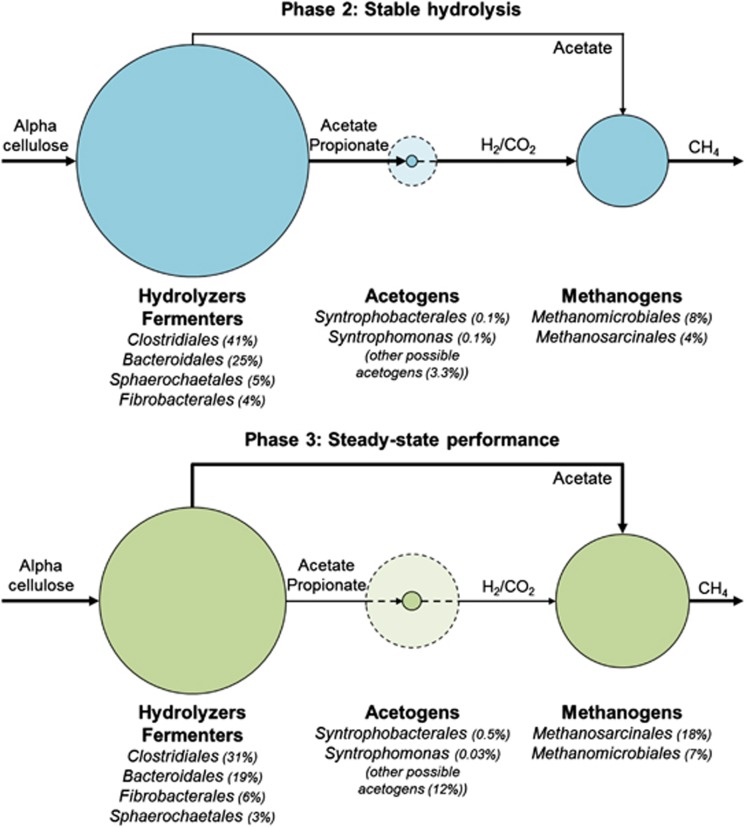
Figure 5.
Schematic of the proposed populations involved in the different steps of anaerobic digestion. The circle size represents the average relative abundance of the populations during phase 2 (blue) and phase 3 (green). During steady-state performance, the functional guilds are more evenly distributed. The dotted circles represent populations belonging to the genus Clostridium and the orders Desulfovibrionales, Desulfuromonadales and Synergistales that may be capable of syntrophic metabolism (McDonald et al., 2008). The arrows indicate the flow of carbon through the system.

