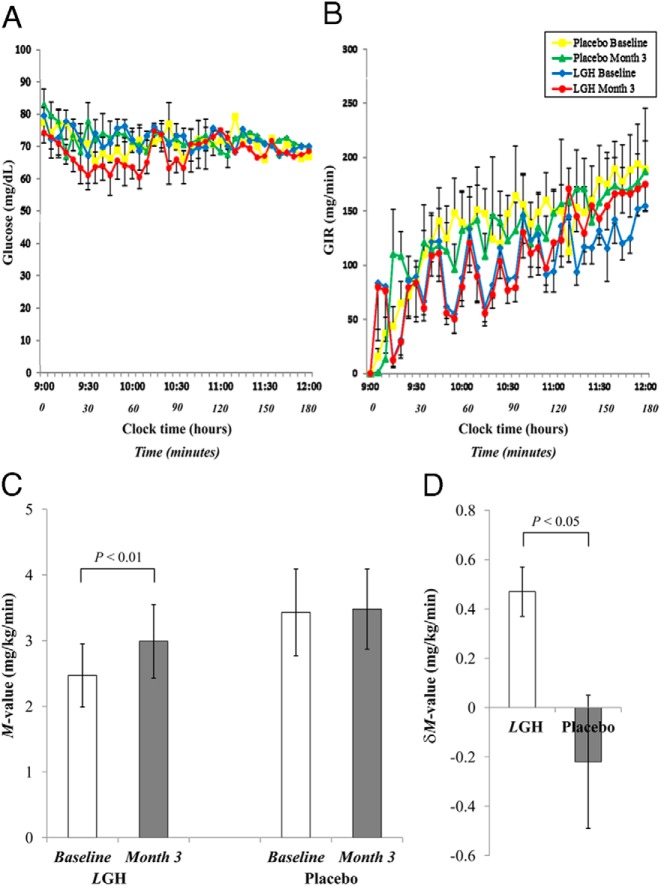
Figure 1.
Glucose levels (A), GIR plotted against time (B), M-value (GIR adjusted for lean body weight) at baseline and month 3 (C), and δM-value (δmonth 3 − baseline) (D) for patients treated by LGH and placebo during the 3-hour hyperinsulinemic-euglycemic clamps at baseline and month 3. Data are presented as mean ± SE.

