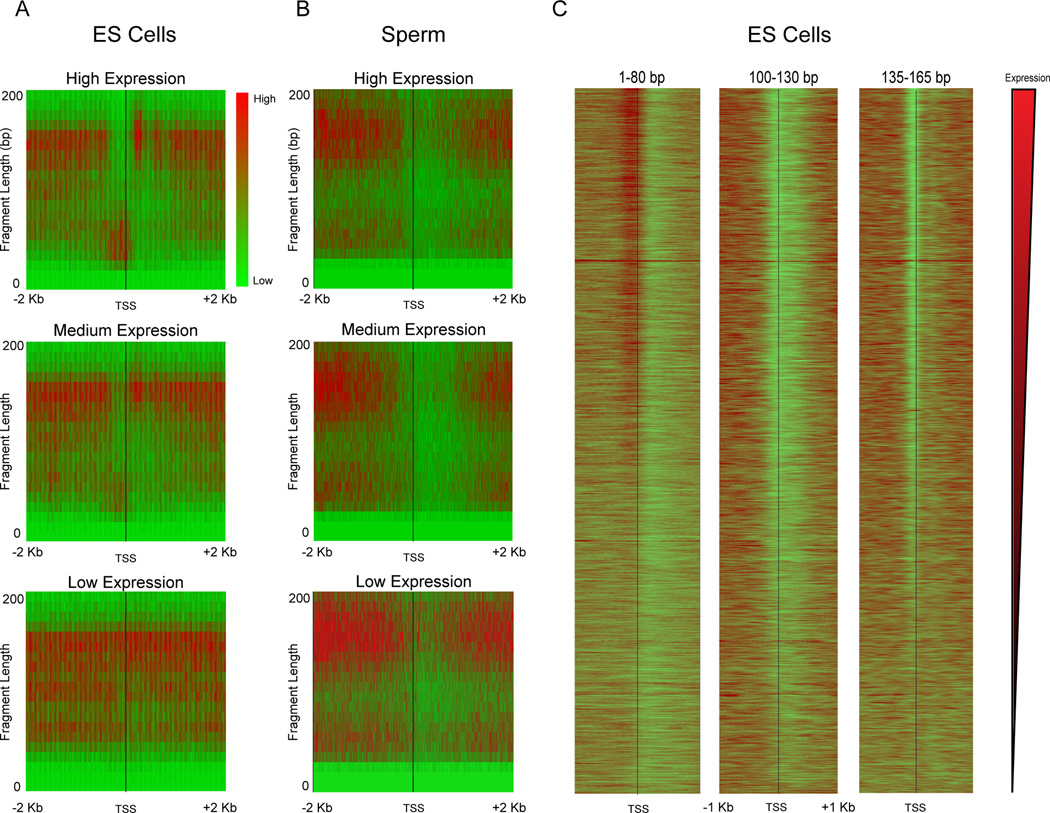
Figure 2. Relationship between transcript abundance and MNase footprinting.
A–B. Enrichment of reads around TSSs is shown in red-green (enriched-depleted) heatmap for genes grouped according to mRNA abundance in E14 mES cells: High (top 5%), Mid (middle 5%), Low (bottom 5%). For each panel, x axis shows distance from the TSS, y axis shows size of the MNase footprint. Data for ES cell MNase digestion is shown in (A), data for mature sperm in (B). Note that sperm “expression levels” derive from mRNA abundance from round spermatids (Namekawa et al., 2006) as mature sperm are transcriptionally inactive. C. Gene-resolution heatmap of deep sequencing reads from ES cell MNase digestion, aligned by TSS for three prominent size classes: <80 bp, 100–130 bp, and 135–165 bp. Each row is a single gene, and rows are sorted from high to low mRNA abundance.

