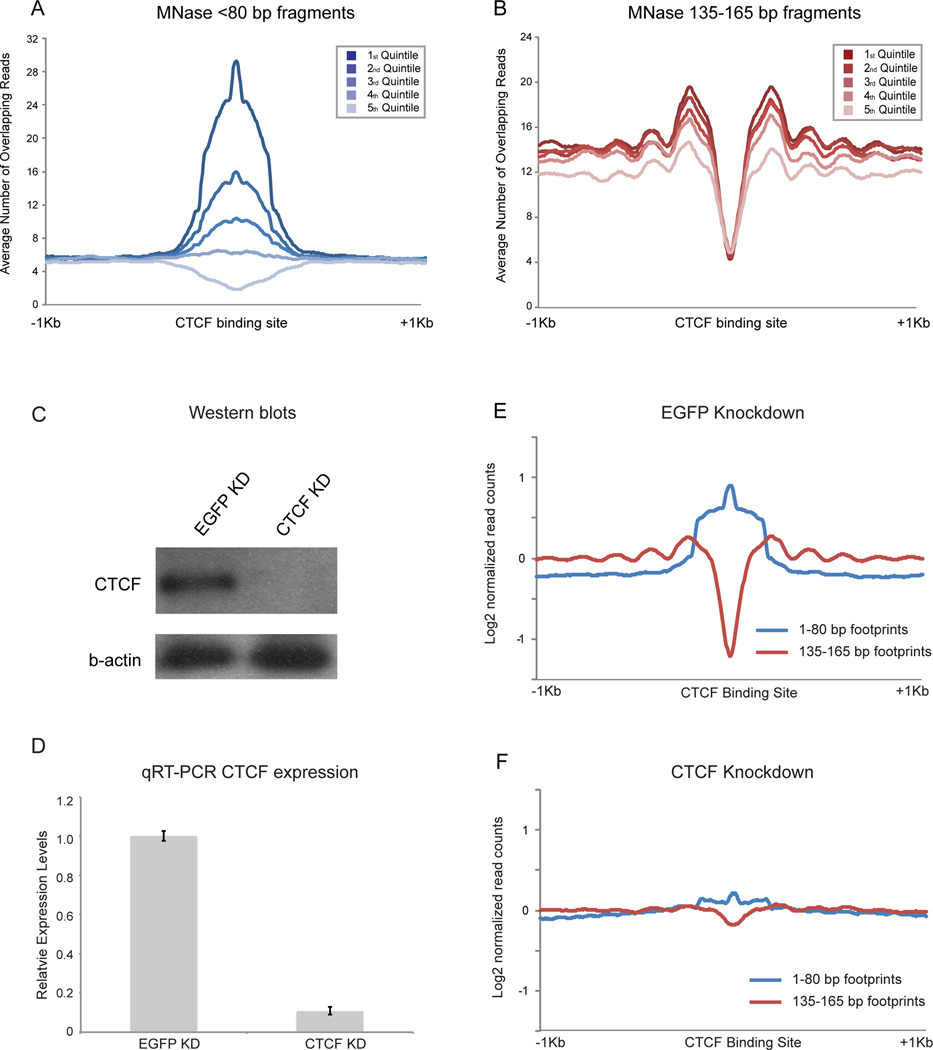
Figure 6. Nuclease-resistant footprints over CTCF motifs represent bona fide CTCF binding in ES cells.
A. Abundance of short MNase footprints over CTCF binding sites in ES cells correlates with CTCF ChIP-Seq enrichment. CTCF motifs are split into quintiles according to ChIP-seq signal (Chen et al., 2008). B. As in (A), but for mononucleosome-length footprints. Flanking nucleosomes are more strongly positioned when CTCF ChIP-seq signal is highest. C. Western blots of CTCF and EGFP esiRNA knockdown in mESCs, probed with anti-CTCF and β-actin antibodies. D. qRT-PCR of CTCF mRNA abundance. E. Aggregation plot for <80 bp and 135–165 bp digestion products in EGFP KD ES cells, aligned using CTCF motifs. F. Knockdown of CTCF in ES cells results in loss of <80bp footprint enrichment over CTCF motifs, with an associated increase in nucleosome occupancy over the CTCF motif and loss of surrounding nucleosome positioning. See also Figures S4–5.

