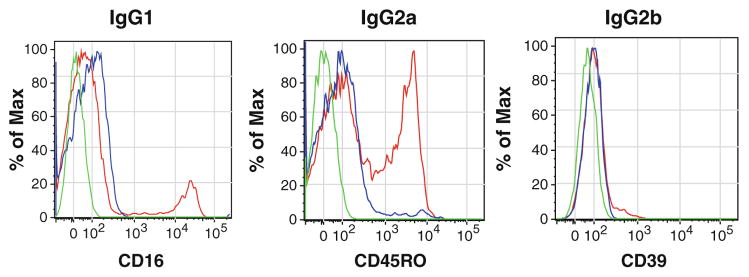
Fig. 4.

Isotype controls. Examples of overlays of unstained cells (green line), isotype control (blue line), and the antibody of interest (red line) for CD16 (IgG1), CD45-RO (IgG2a), and CD39 (IgG2b) antibodies. Isotype controls were used at the same concentration as the antibody of interest
