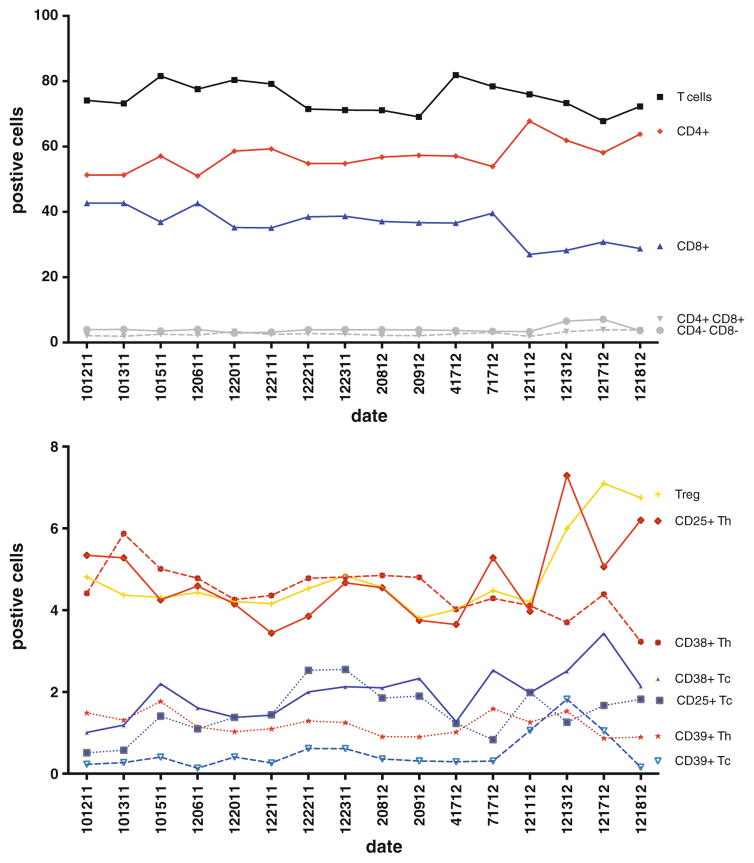
Fig. 7.
Sample normalization. A Levy-Jenning plot showing iterative analysis over a 2-year period of aliquots from a single sample (CHI-002) stained with our 15-color T regulatory cell tube. a T cells and T cell subpopulations CD4+CD8−, CD4+CD8+, CD4−CD8+, CD4−CD8− are indicated. b Discrete markers such as activation markers on T CD4+ cells and T CD8+ cells and on CD4+ regulatory T cells were identified

