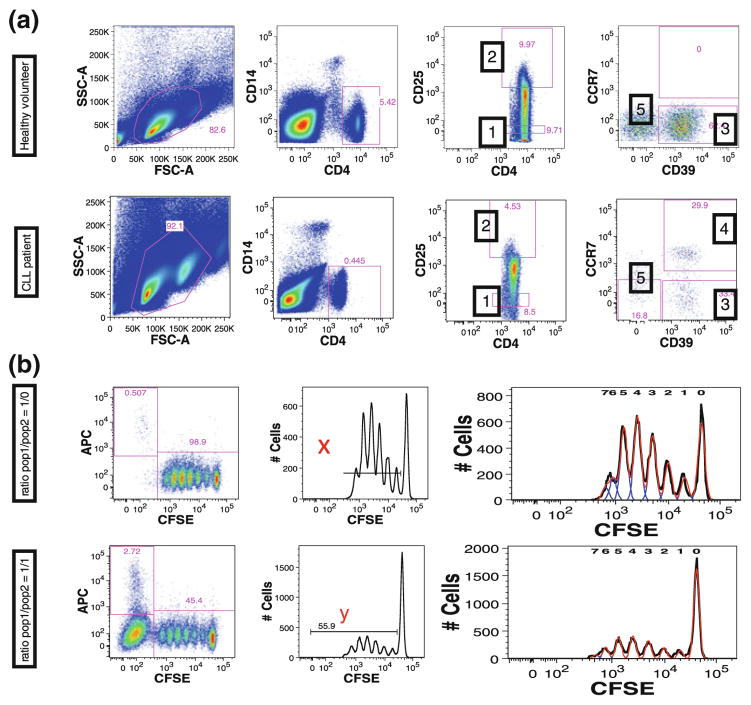
Fig. 8.
Sorting of populations identified by CLIP. a Based on immunophenotyping findings we stained cells in an identical manner, but without permeabilization and without FOXp3 staining, to study suppressive activity of these cells. Five populations were sorted and are identified by numbers: (1) CD4+CD25− (effector T cells), (2) CD4+CD25high (Treg), (3) CD39+ Treg, (4) CD39+CCR7+ Treg, and (5) CD39−CCR7−Treg. b Suppressive capacity of Treg cells on effector T cells was expressed as relative inhibition of the percentage of CFSElow cells according to the following formula [100 × (1 − (x/y))] where x is the percentage of CFSElow cells in the effector T cell population alone culture and y is percentage of CFSElow cells in co-culture of Treg and effector T cells

