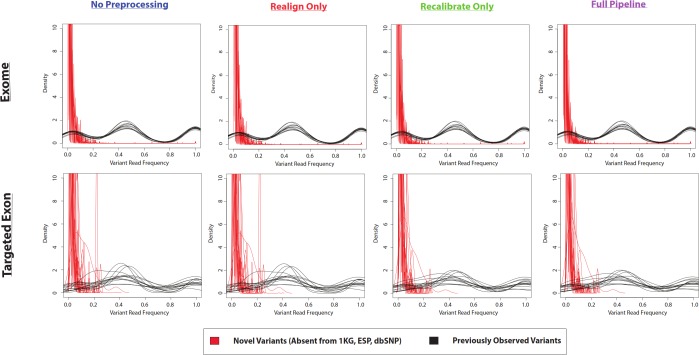
Figure 4. Frequency of reads supporting coding VarScan-Default SNP variants (1KG Exome—chr20).
Density plots for novel variants (those variants not reported in the 1000 Genomes Project, the Exome Sequencing Project, or dbSNP) are shown with red lines while density plots for previously observed variants are shown with red lines. Notice that most novel variants have a very low frequency of supporting reads, with a trend so strong that it cannot be observed on the scale of the current figure (although a rescaled figure is shown in Fig. S4, to emphasize the radically different density distributions). We believe that this because the majority of variants with less than 30% supporting reads are due to sequencing errors, which is why the height of the peak (in Fig. S4) approximately matches the error rate (∼1%). This distribution looks similar regardless of pre-processing pipeline or target design (e.g., exome versus targeted exon).

