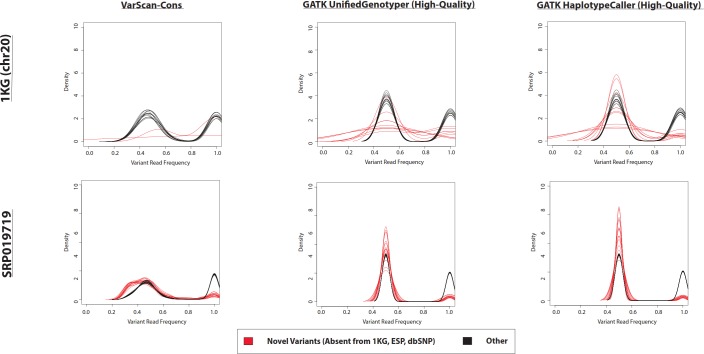
Figure 5. Frequency of reads supporting SNP variants in exome datasets.
Density plots for novel variants (those variants not reported in the 1000 Genomes Project, the Exome Sequencing Project, or dbSNP) are shown with red lines while density plots for previously observed variants are shown with red lines. Density plots are shown for two datasets (1000 Genomes and SRP019719) with 3 lists of variants (VarScan-Cons, high-quality GATK UnifiedGenotyper, and high-quality GATK HaplotypeCaller). Density plots are only created for variant lists with greater than 2 variants, so some samples do not have novel variant density plots. Notice that the high-quality GATK variants lists lack variants with low percentages of variant reads (as was the case for VarScan-Default, Fig. 4), similar to VarScan-Cons. This shift in supporting read frequencies correlates with the concordance rates (Fig. 3) and the novel variant frequencies (Fig. 7) for the corresponding variant lists.

