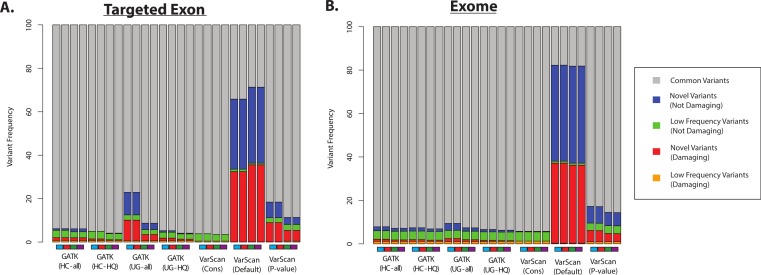
Figure 7. Distribution of ANNOVAR annotations for coding SNP variants (1KG—chr20).
(A) Distribution of variant types defined in the ANNOVAR exome report for selected 1000 Genomes (1KG) targeted exon samples (n = 14). Variants are classified based upon population frequency and damaging prediction (see Methods). Low frequency variants (MAF < 0.01) that are displayed in orange if they are predicted to be damaging and are displayed in green if they are not predicted to be damaging. Novel variants are displayed in red if they are predicted to be damaging and are displayed in blue if they are not predicted to be damaging. Although all samples should contain some novel variants, a high proportion of novel variants are expected to correlate with a high false positive rate. Seven variant calling strategies were tested (GATK UnifiedGenotyper and HaplotypeCaller, with and without filtering low quality variants; VarScan with 3 sets of parameters, see Methods). “VarScan-Cons” is the most conservative set of parameters for VarScan. Each variant caller was also tested with 4 preprocessing conditions, corresponding to the colored boxes under the bar plot: variants called using both GATK indel realignment and quality score recalibration (purple), indel realignment only (red), quality score recalibration only (green), or neither (blue). (B) Same as (A), but for selected 1000 Genomes exome samples (n = 12, Table S2).

