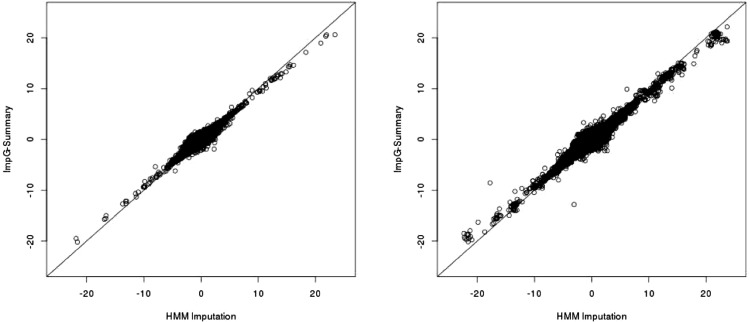
Fig. 3.
HMM-imputed (x-axis) versus ImpG-Summary (y-axis) association statistics (z-scores) for the TG phenotype in the blood lipids data. Left denotes imputation of 10% of the z-scores using the remaining 90%, while right shows imputation results starting from all variants present on the Illumina 610 array. Results for all blood lipids phenotypes can be found in Supplementary Figure S13. ImpG-Summary took 4 CPU days for the 10% data and under 10 CPU h for the array-based imputation

