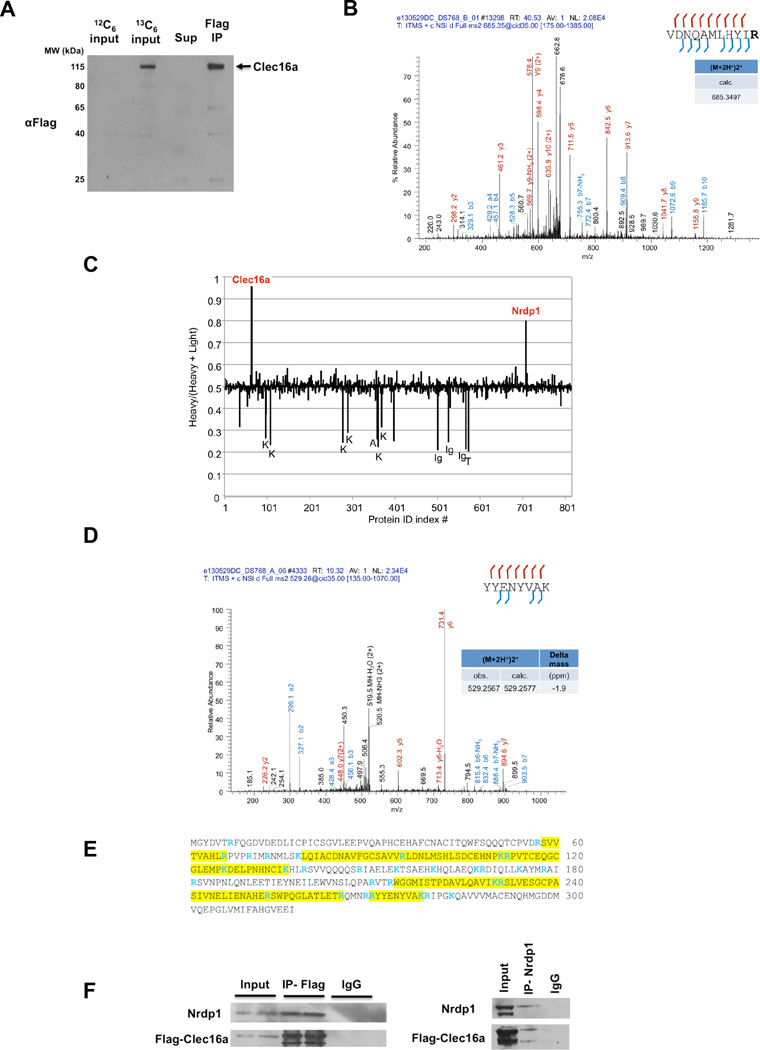
Figure 1. I-DIRT identifies Clec16a interaction with E3 ubiquitin ligase Nrdp1.
(A) Representative Western blot (WB) of parental NIH3T3 fibroblast (12C6-labeled) or stably expressing Flag-Clec16a NIH3T3 fibroblast (13C6-labeled) input protein lysates, supernatant and Flag immunoprecipitation for Flag-Clec16a (n=6). (B) MS/MS map marked with b ions (blue) and y ions (red) for Clec16a specific peptide sequence with calculated m/z ratios. Heavy residue indicated in bold print in peptide sequence. (C) I-DIRT ratios for >800 proteins identified from 6 independent I-DIRT experiments with calculated non-specific value of 0.5. Clec16a and Nrdp1 peaks indicated. Contaminant peptides (human keratin (K), immunoglobulins (Ig), trypsin (T), and albumin (A)) indicated by peaks below non-specific interactors. (D) MS/MS map marked with b ions (blue) and y ions (red) for an Nrdp1 specific peptide sequence with observed and calculated m/z ratios. (E) Amino acid sequence of Nrdp1 with peptides identified by MS (highlighted residues). Trypsin cleavage sites demarcated in blue. (F) Representative WB (3 independent experiments) of lysates of Flag-Clec16a NIH3T3 fibroblasts following anti-Flag IP (left) or anti-Nrdp1 IP (right).

