
Figure S1. Modules 4 and 11 from the TCGA ovarian cancer mutation data file generated by using the 2013 version of the FI network.
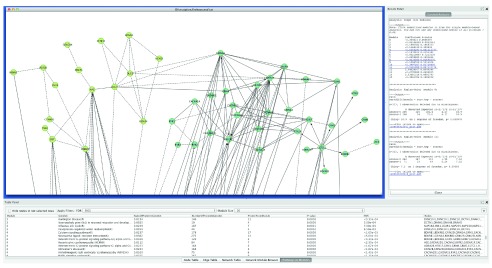
The central panel shows the network view of module 4 (right in lightseegreen) and module 11 (left in darkkhaki). The bottom table displays pathway annotations for module 4. The right panel shows survival analysis results using the CoxPH model for modules containing genes no less than 10 and the Kaplan-Meier model for modules 4 and 11.