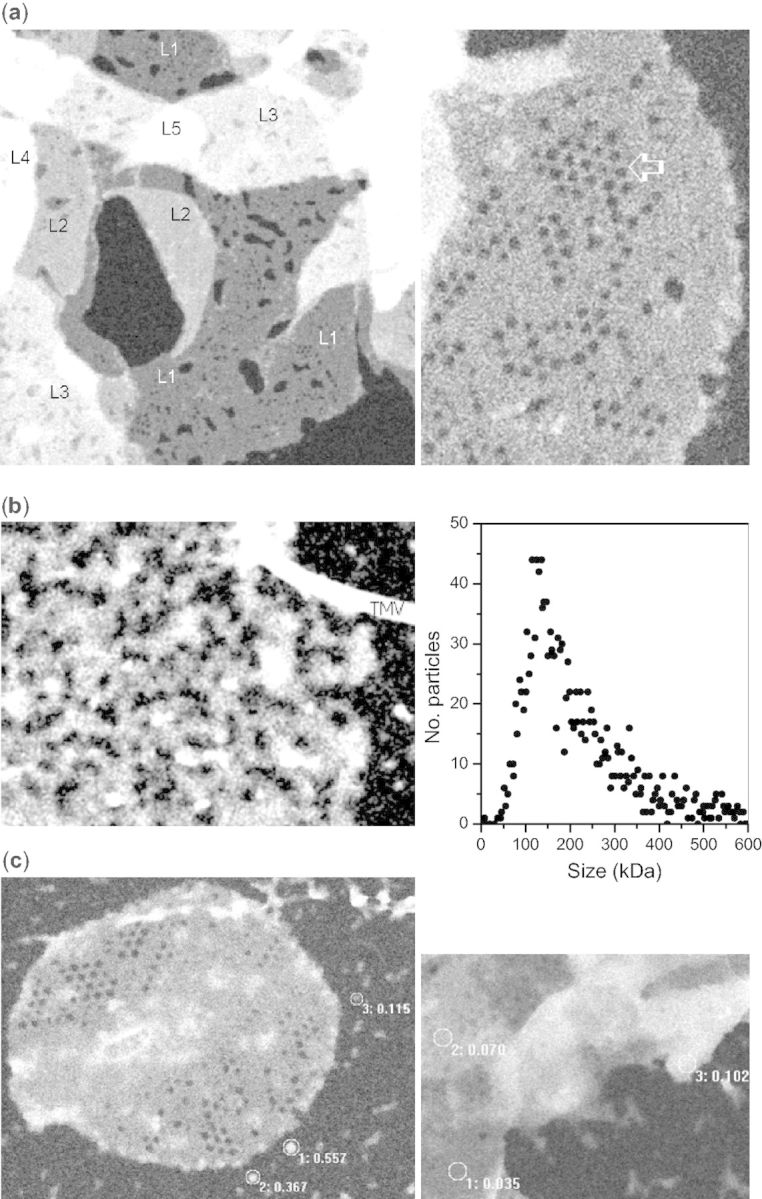
Fig. 2.

STEM images of lamellar aggregates of LHCII in the dark (a), after 3 min illumination of the sample with heat-filtered red light of 2,200 µmol photons m−2 s−1 (b) and after 3 min light and 10 min dark (c). Scale bar = 500 Å. Tobacco mosaic virus, seen in (b), is added to calibrate density. In (a) and (c), labels indicate the number of superimposed sheets in the circled area and corresponding density (M/A) in kDa/Å2. Shown in (b; right panel) is the mass distribution profile of 1,530 particles from 23 images of the same preparation after 3 min illumination. (“Noise” in these images is due to low-dose imaging conditions needed to preserve structure.)
