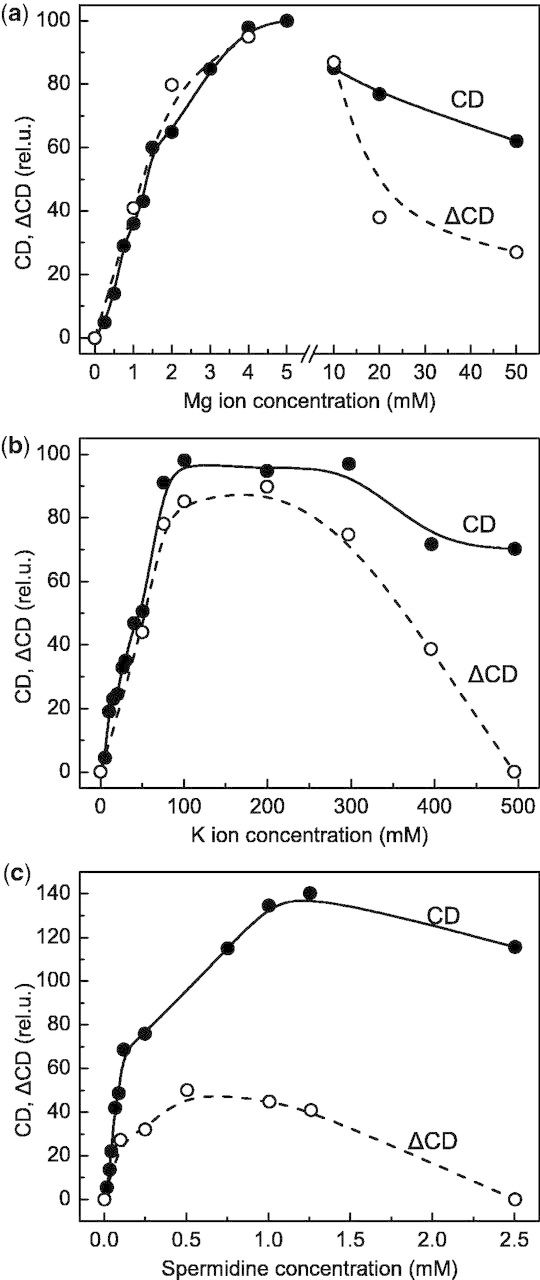
Fig. 3.

Dependence of the relative amplitudes of the main psi-type circular dichroism bands in the red spectral region (CD) of isolated pea thylakoid membranes, and the relative amplitudes of the light-induced CD changes at (+)690 nm (ΔCD elicited by broad-band blue excitation of 500 W m−2) on the concentration of different cations, Mg2+ (a), K+ (b) and spermidine (c). The maximum amplitudes in (a) were taken as 100%; the same CD and ΔCD amplitudes were used in (b) and (c) as reference values. For further details, see the Materials and Methods.
