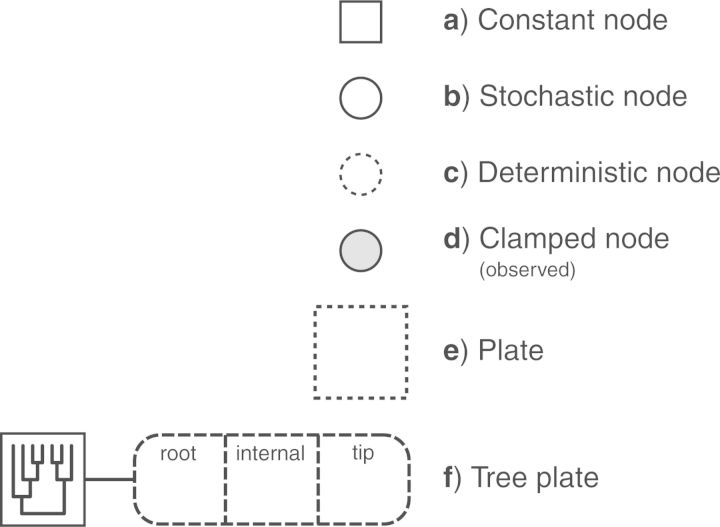
Figure 1.
The symbols for a visual representation of a graphical model. a) Solid squares represent constant nodes, which specify fixed-valued variables. b) Stochastic nodes are represented by solid circles. These variables correspond to random variables and may depend on other variables. c) Deterministic nodes (dotted circles) indicate variables that are determined by a specific function applied to another variable. They can be thought of as variable transformations. d) Observed states are placed in clamped stochastic nodes, represented by gray-shaded circles. e) Replication over a set of variables is indicated by enclosing the replicated nodes in a plate (dashed rectangle). f) We introduce replication over a structured tree topology using a tree plate. This is represented by the divided, dashed rectangle with rounded corners. The subsections of the tree plate demark the different classes of nodes of the tree. The tree topology orders the nodes in the tree plate and may be a constant node (as in this example) or a stochastic node (if the topology node is a solid circle).

