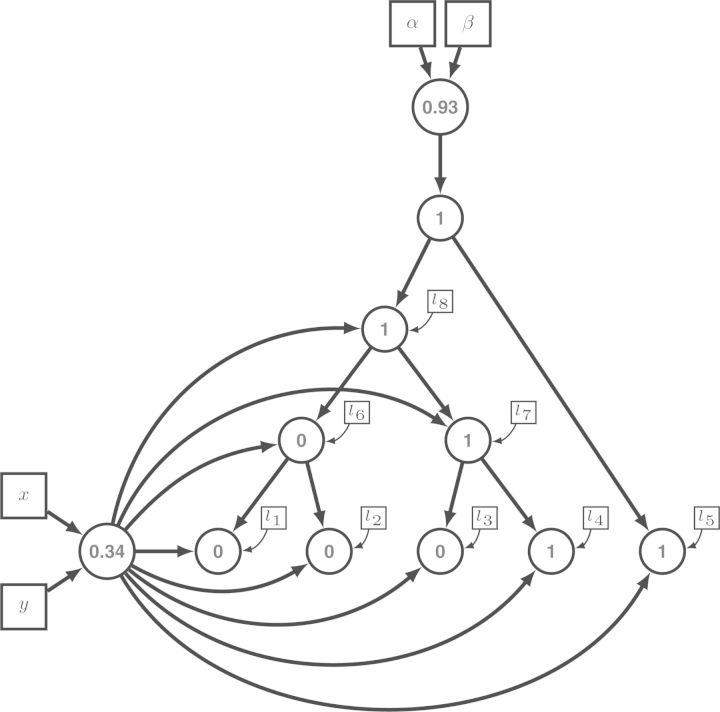
Figure 10.
Simulation of data using the graphical model of Figure 3. All simulated values are colored in blue. First, the root probability is drawn from a Beta(α = 1,β = 1) distribution, yielding 0.93, and the stationary probability is drawn from a Beta(x = 1,y = 1) distribution resulting 0.34. Then, the characters of the root node followed by the characters of the internal nodes and tip nodes are simulated under the two-state continuous time Markov process.

